Fifth Field Trip to Alice Holt Forest
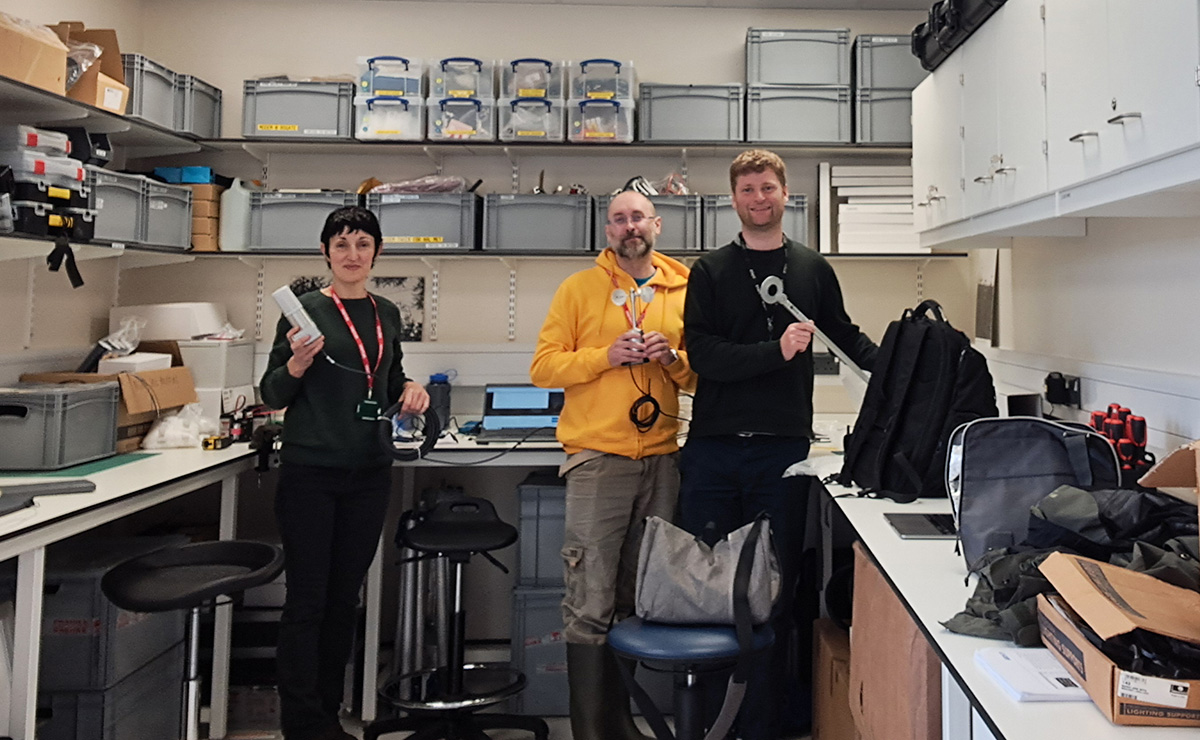
Photo: From left to right: Anna Xambó holding a CO2 concentration sensor, Luigi Marino holding an anemometer sensor, and Mike Bell holding a net radiation sensor.
On Wednesday 22 May, Luigi and I went to visit Mike at the Alice Holt Forest Research Station on our fifth field trip to do a mini-hackathon to progress with the development of the customised data logger and related web services.
From Bentley Rail Station to Alice Holt Forest Research Station
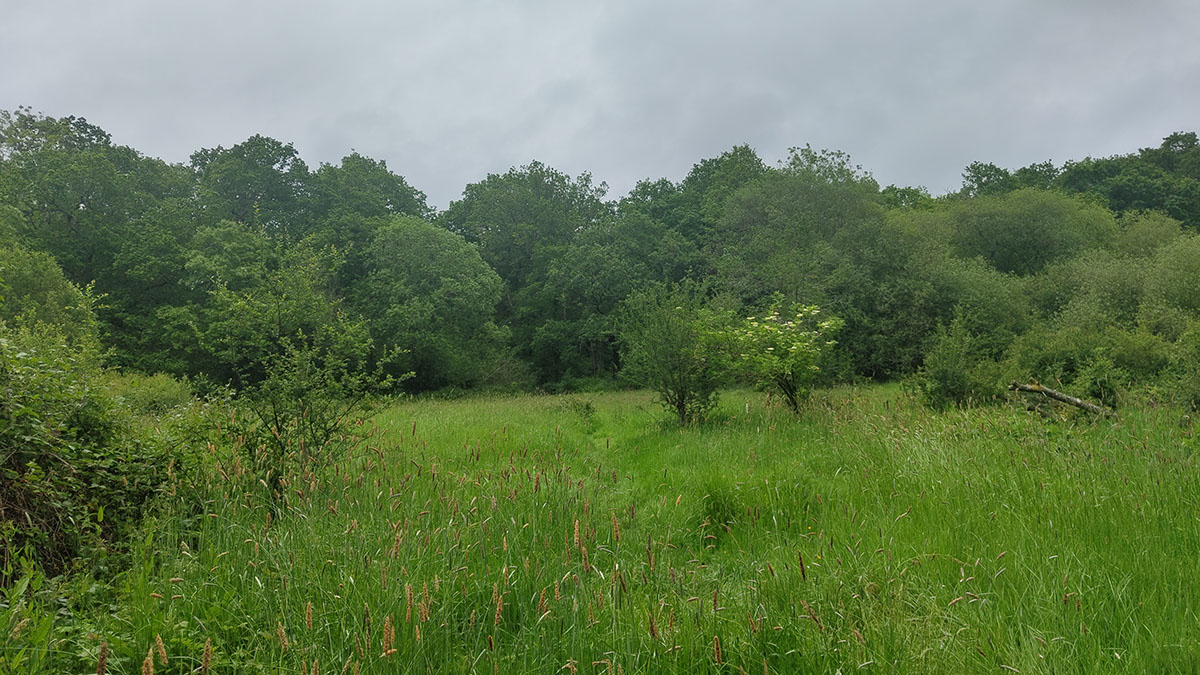
Getting to the Alice Holt Forest Research Station from the train station is halfway to getting to the Alice Holt Forest. This time, I explored the Bentley Station Meadow Reserve, a reserve that has been owned and managed by Butterfly Conservation. According to the poster description, “it suits the butterflies of both grassland and woodland, providing the food plants for their caterpillars and nectar sources for the adults”. The meadow is fantastic but I could not see any butterflies!
Collecting Streamer I
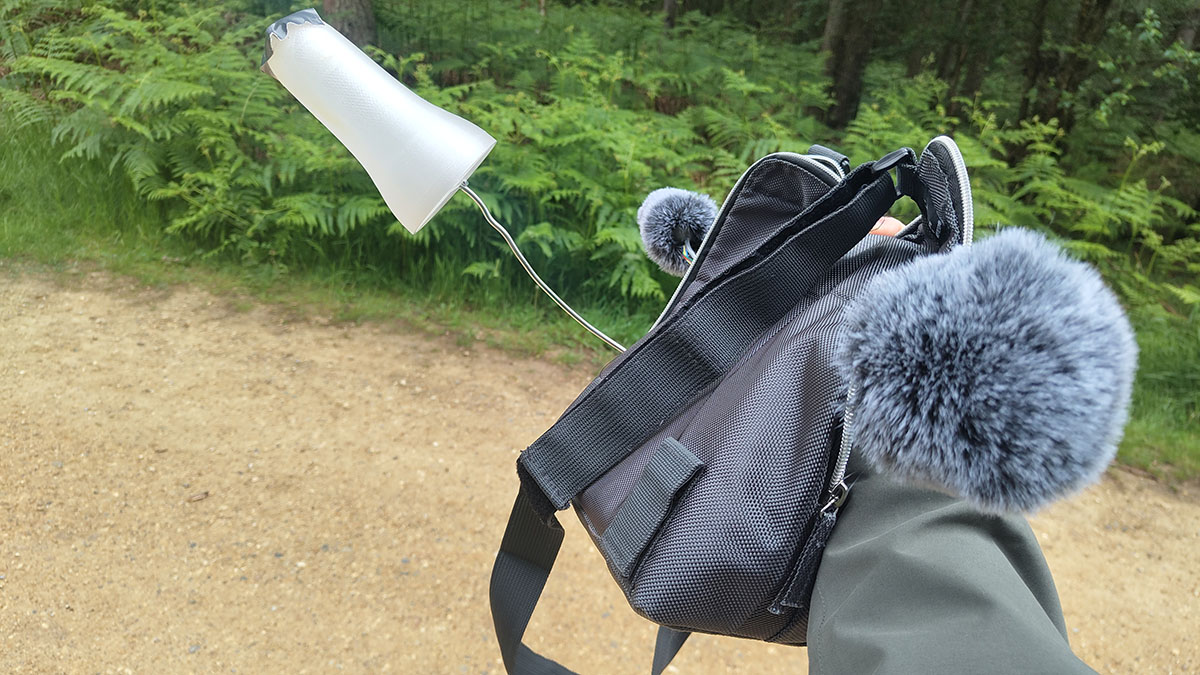
Before meeting with Mike and Luigi, I went to the Alice Holt Forest Visitor Centre to collect Streamer I, which was successfully launched in our fourth field trip in the Alice Holt Forest. On one of the mirrors of the women’s toilets in the Alice Holt Visitor Centre, you can read the quote:
“The forest is full of wildlife. But you’ll have to be quiet to see it”.
It is also true that:
“The forest is full of wildlife. But you’ll have to be quiet to hear it”.
Data logger
At Forest Research, data loggers are used to measure a range of environmental variables that help scientists understand the carbon balance of the forest. For the Sensing the Forest project, Mike is developing a customised data logger for measuring air temperature, relative humidity, wind speed, photosynthetically active radiation, net radiation and carbon dioxide concentration. The system will be powered by a solar panel, and data will be sent via a cellular modem to an online server that the artists can access.
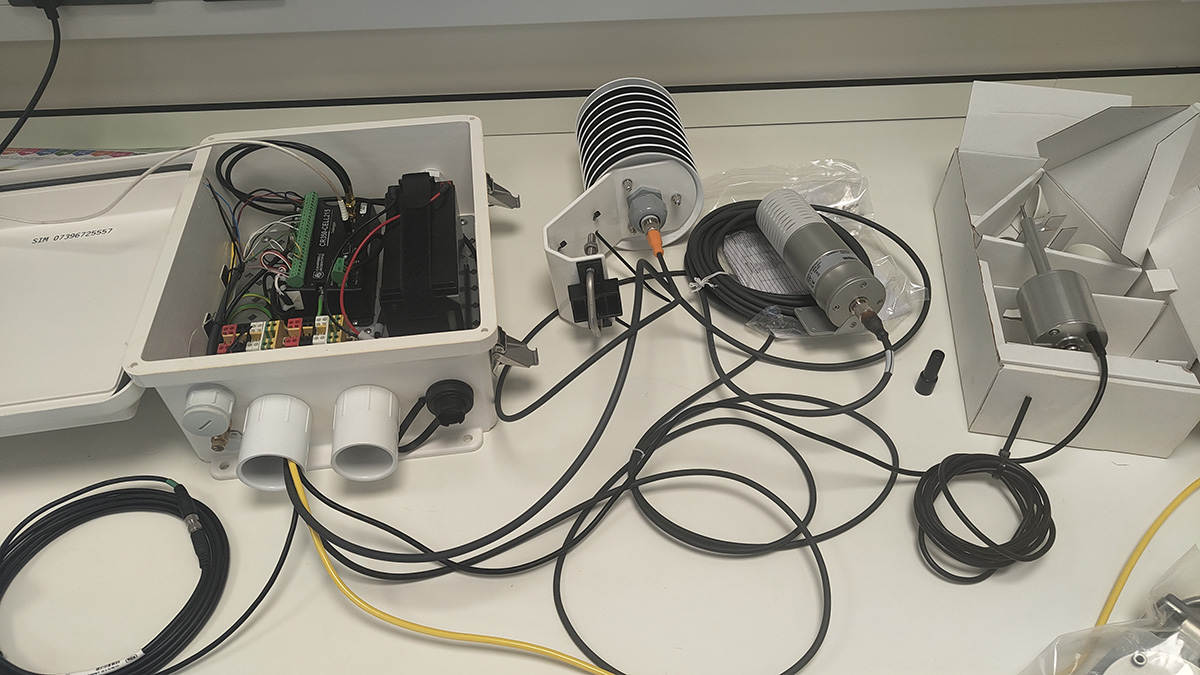
The customised data logger comprises two main components:
- The hardware with the weather sensors.
- The software with a JavaScript web server and a Pure Data web client example for artists to use, which is suitable for embedded devices such as the Raspberry Pi.
Mini-hackathon
Objectives
Our main objectives to fulfil in this mini-hackathon were to:
- Get familiar with the data logger (Luigi, Anna)
- Complete the communication between the hardware and the web server (Mike)
- Decide frequencies of data transmission (All)
- Test the JSON readings in the web server and Pure Data web client (Anna, Luigi)
- Polish the web server and Pure Data code accordingly (Anna, Luigi)
- Create a Pure Data music example (Luigi)
Hardware
First, we got familiar with the different sensors that Mike wants to include in the data logger.
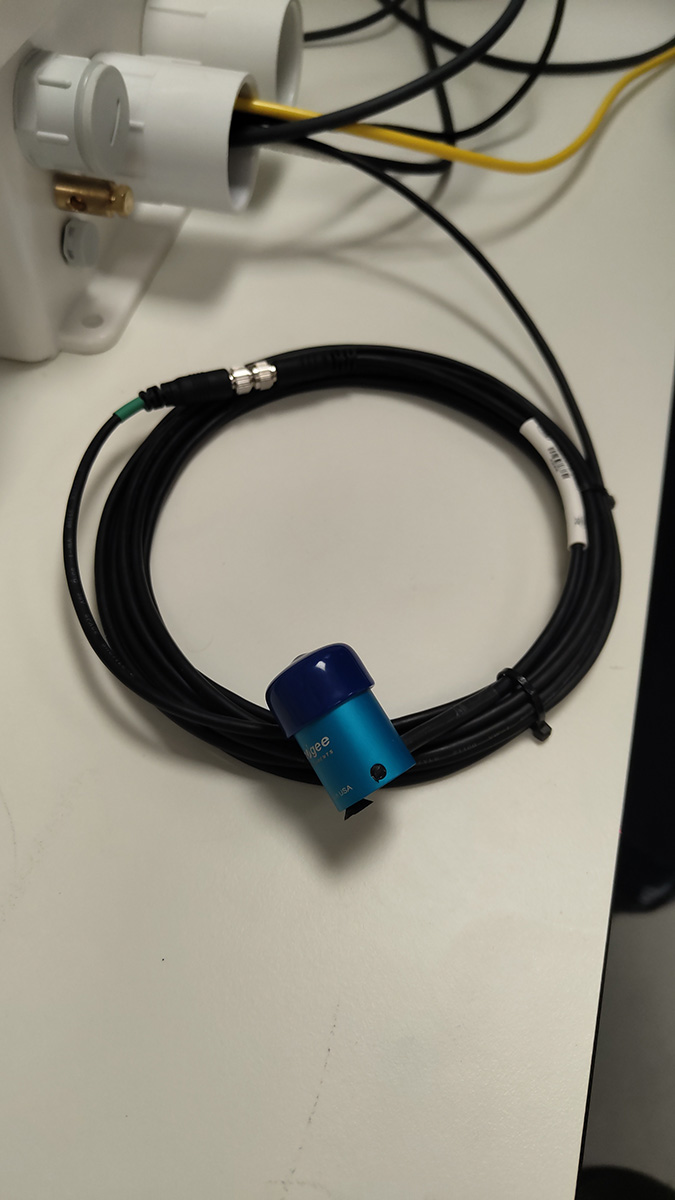
Photosynthetically active radiation sensor (PAR)
The photosynthetically active radiation (PAR) sensor is an instrument for measuring solar radiation from 400 to 700 nanometers, which is used by photosynthetic organisms for the process of photosynthesis (active radiation).
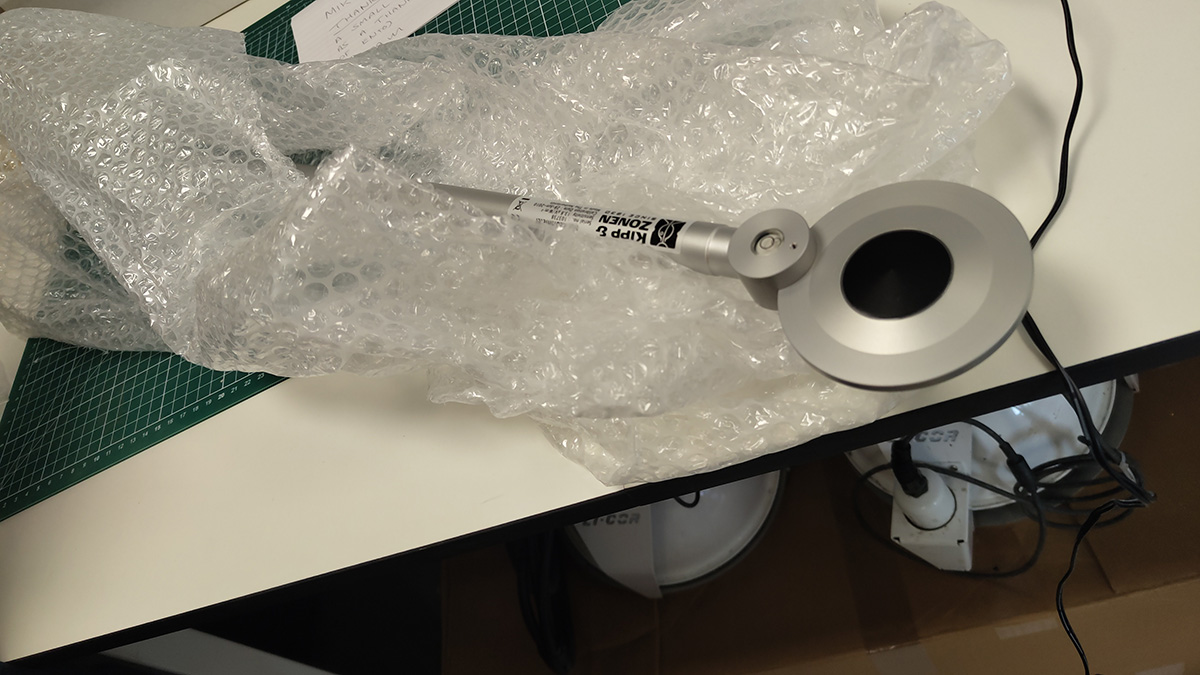
Net radiation sensor
The net radiation sensor is an instrument for measuring the balance between incoming and outgoing radiation under outdoor conditions.
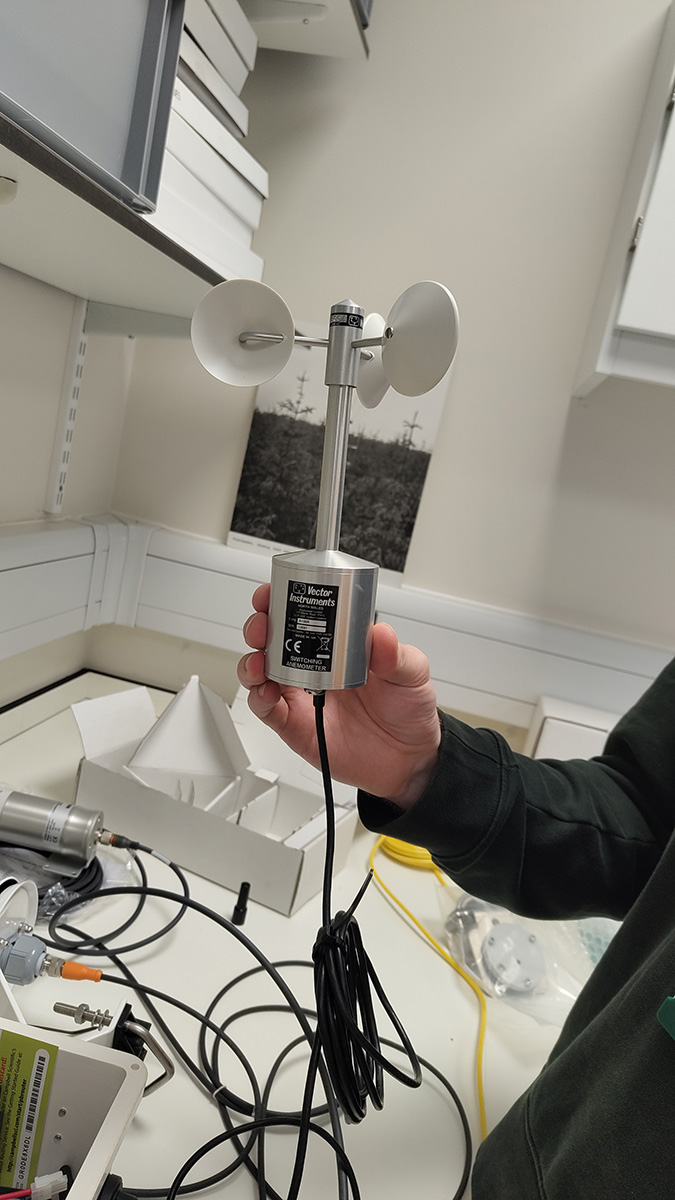
Wind speed (anemometer)
The anemometer sensor is an instrument for measuring the speed of the wind.
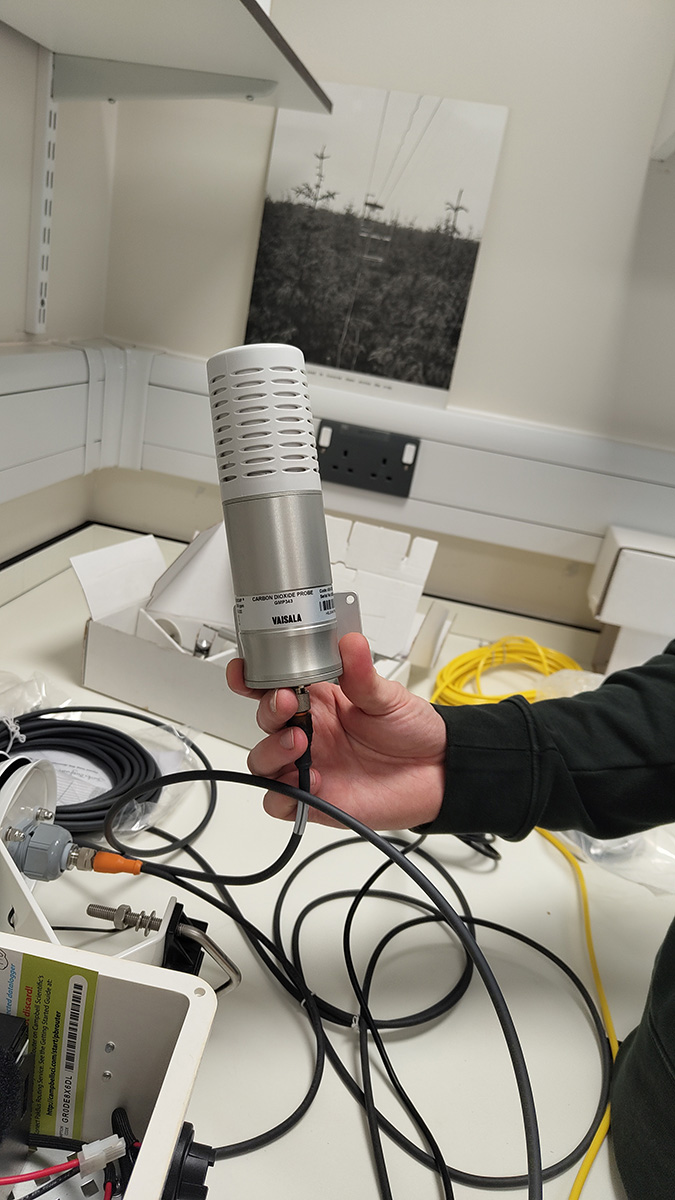
Carbon dioxide concentration sensor
The carbon dioxide concentration sensor the CO2 is an instrument that measures the level of carbon dioxide as a percentage of a volume of air.
Air temperature & relative humidity
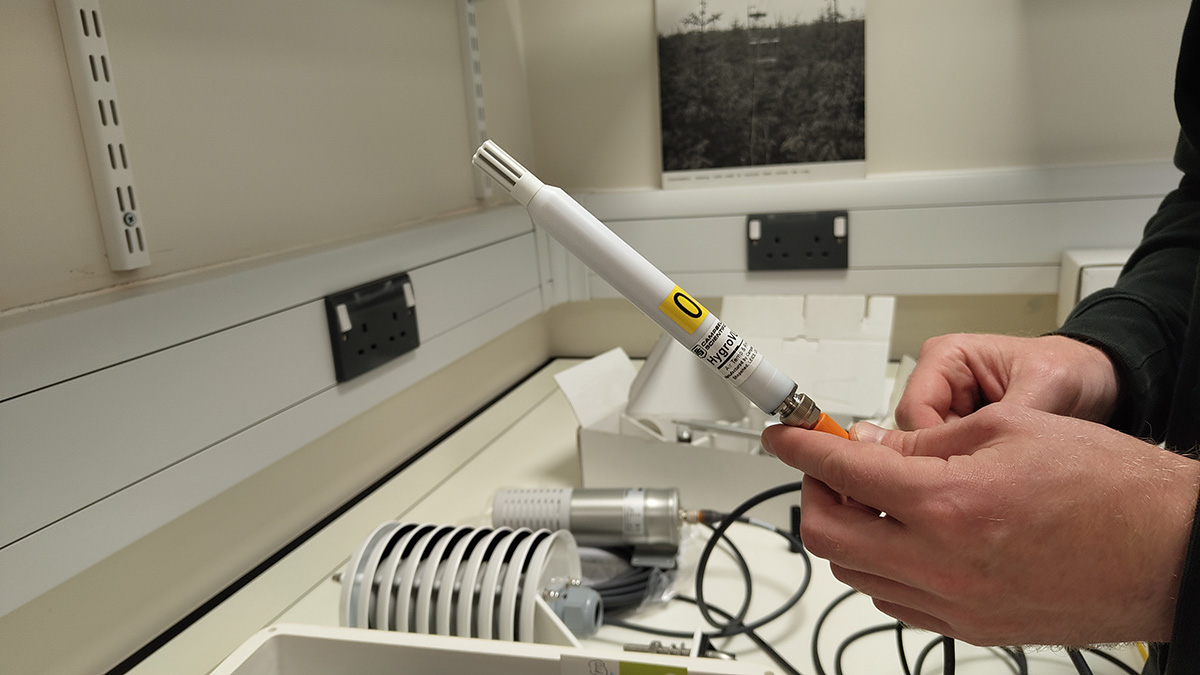
The HygroVue™10 sensor is a smart sensor that combines air temperature and relative humidity and has a digital SDI-12 output. Air temperature monitors the temperature of the air. Relative humidity measures water vapour relative to the temperature of the air.
Software
We then worked on the creation of the JSON file to be sent from the data logger to the web server. The programming language is CRbasic, and we found some constraints in terms of the length string limit due to the large number of variables that we want to send! We agreed on the naming of variables to be human-friendly. Most of the variables include average, minimum and maximum values.
Although we expect to transfer the data at three different frequencies (1min/5min/30min), for now ,we are developing for the 1min frequency.
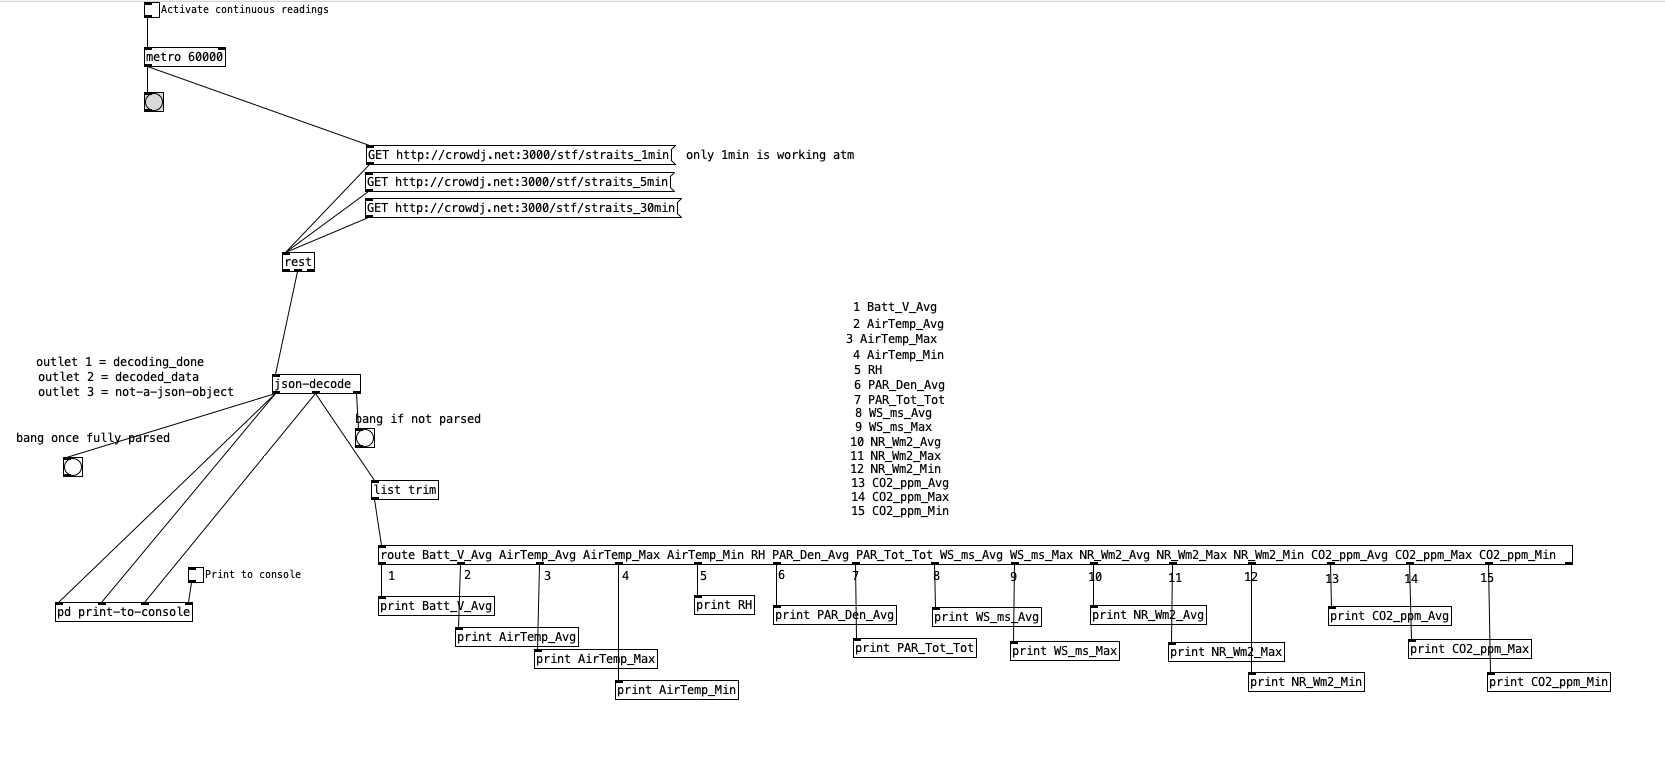
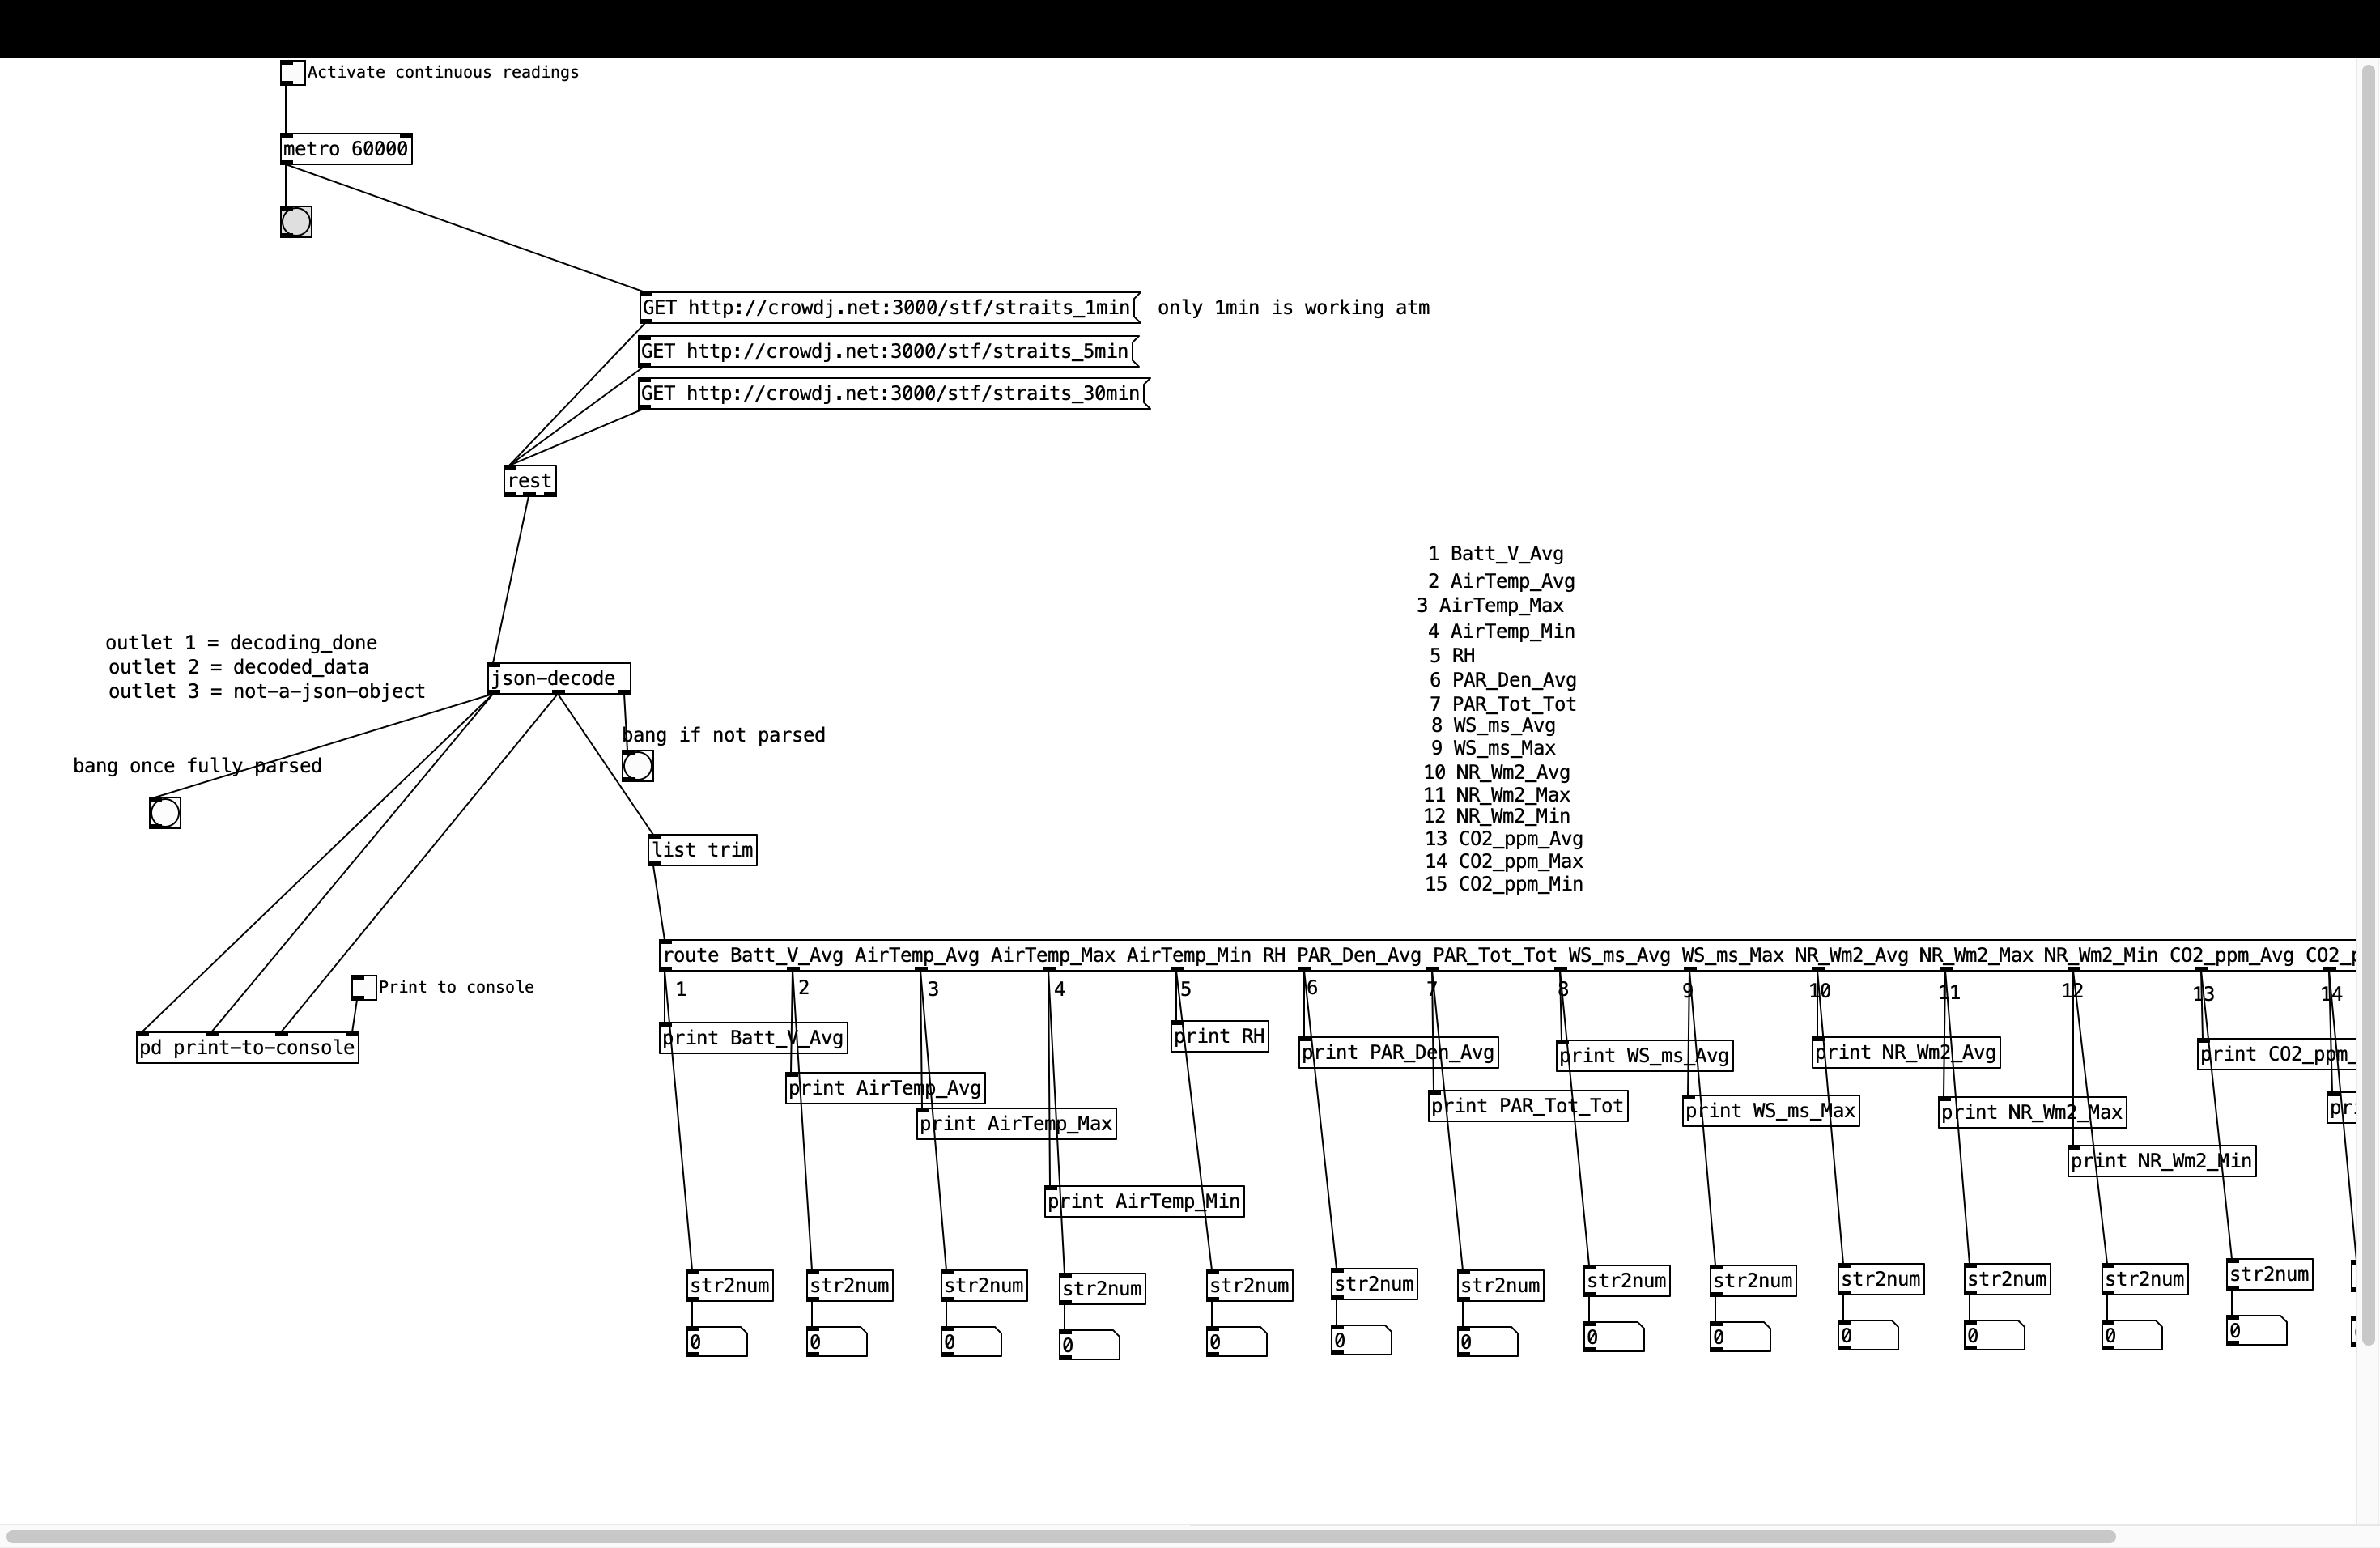
We also tested the Pure Data web client and decided that just parsing the values from the JSON file should suffice for the artists and musicians to progress with their musical patches.
Follow-up
After the visit, Mike solved the problem of CRbasic related to sending a long string of variables and values to the web server and I polished the basic Pure Data patch for Pete and the interested artists to use. We are employing the PuRestJson external to parse the incoming JSON files into Pure Data. We found that the external version for Raspberry Pi works well with our initial patch, but for the Mac version, we had to hack a bit the patch to convert the values conceived as lists to float numbers.
The next steps include:
- Change the web server to a 1-year plan and create a historic dataset.
- Set the data logger outside.
- Write a quick HelpFile: we will create a basic HelpFile HTML page listing all the variables used.
- Create a musical example.
We plan to release the web server and Pure Data code once it is ready. For now, it is available for Pete and the summer school participants. While we are preparing the art event on the 20th of June, we will continue testing and tuning the hardware and software.
The data logger will be showcased by Mike during the exhibition on the 20th of June and later will be set more permanently in the weather station at the Straits Inclosure. Pete’s installation will demonstrate an artistic application of using weather data from the logger and Luigi is planning to explore data-music mappings for his musical practice.
As per the data logger, a second step (of low priority now) will be to think also about capturing photos, which could be tuned with a frequency similar to the audio recordings of the streamers.
The mini-hackathon was successful because we could work in a team, learn from each other, and progress to the “almost-there” moment. Luigi and I could also ask Mike about the Forest Research’s experience on powering off-grid systems, which we are currently dealing with the streamers and Pete’s installation.
Thanks, Mike and Alice Holt Forest Research for hosting us and making the mini-hackathon possible! Thanks to Danielle for coordinating our collection of Streamer I at the Alice Holt Visitor Centre. Also thanks to Gerard for his technical advice on Pure Data.
