Hackathon at Northern Research Station Edinburgh - Day 2
📷 Group Photo and Portraits by Mahmoud Elmokadem. From left-right, Subhash Arockiadoss, Luigi Marino, Georgios Xenakis, Anna Xambó, Stanley Parker, Ning Liu, and Mahmoud Elmokadem.
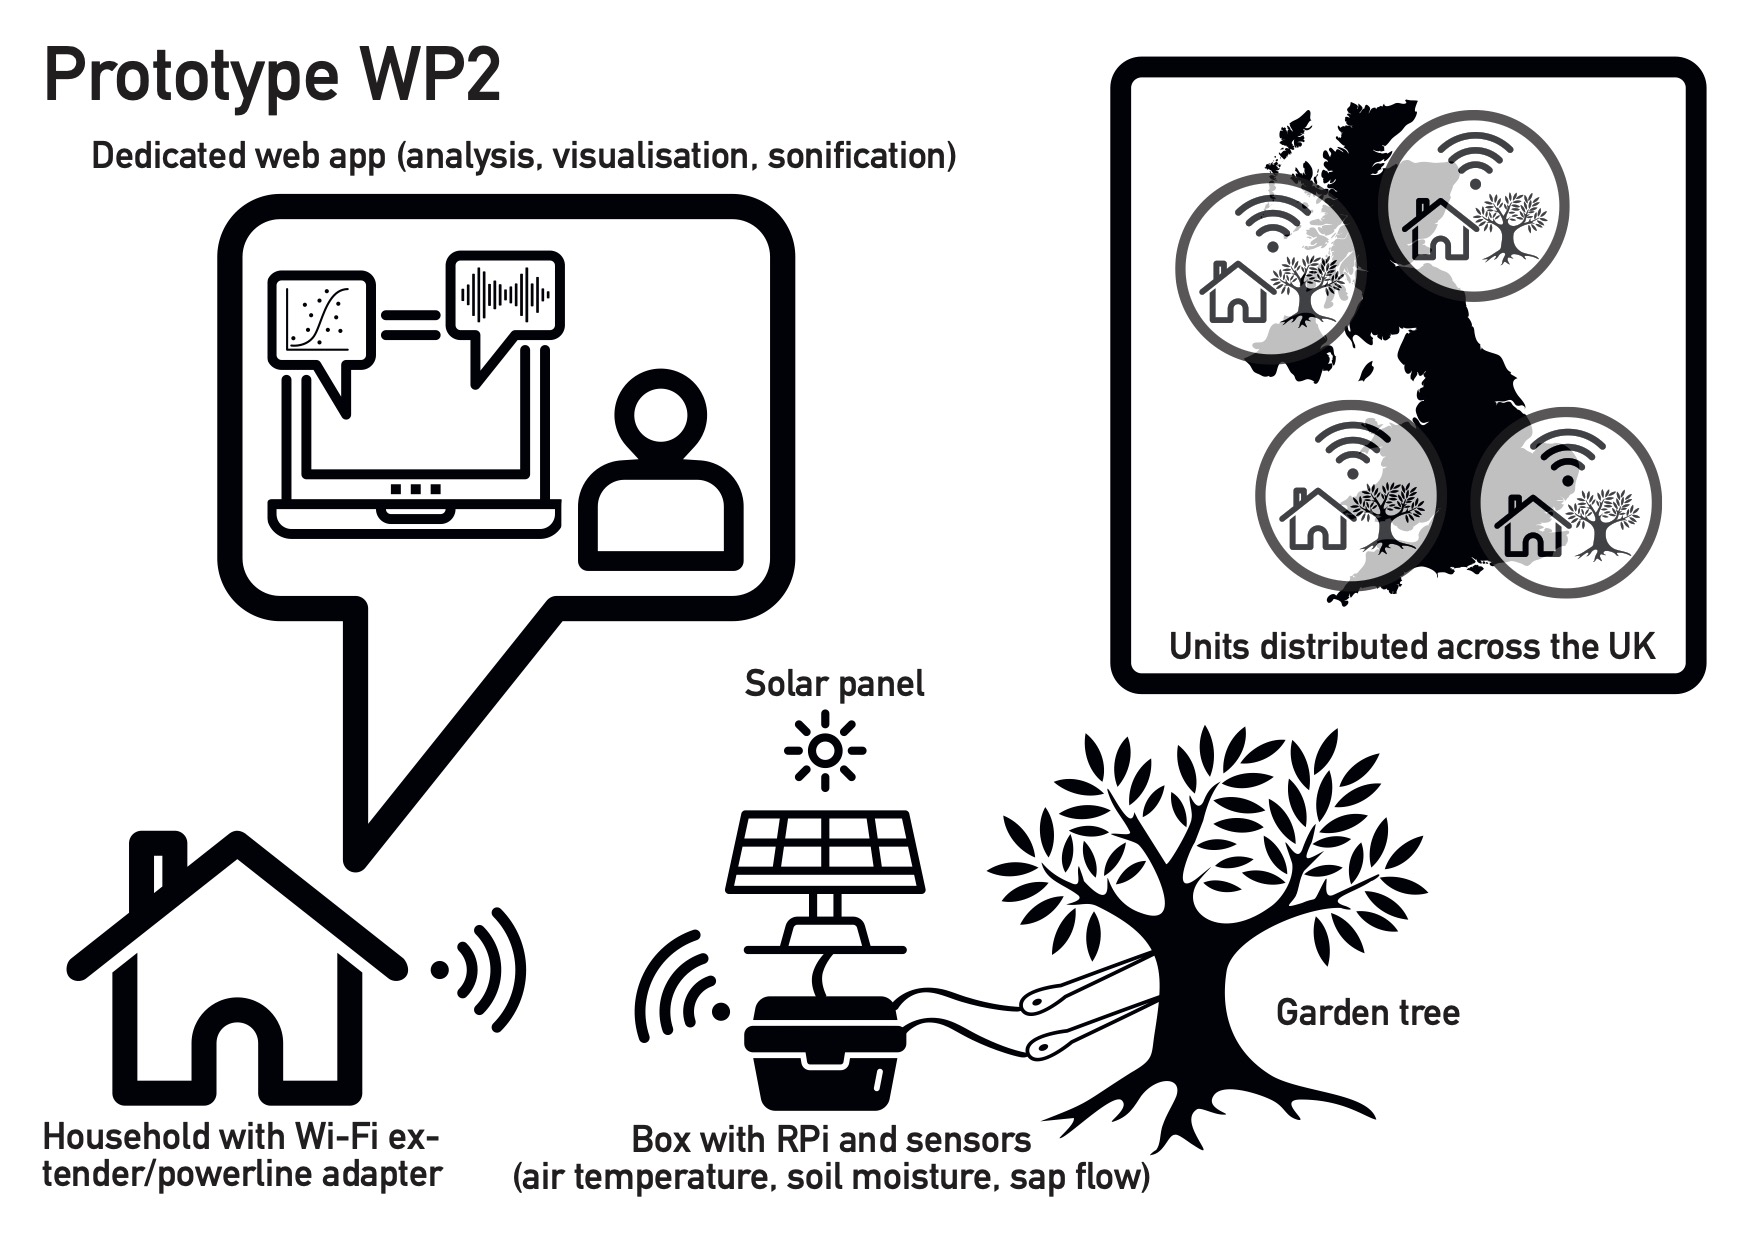
We met for the second day of our 2-day Sensing the Forest hackathon at the Forest Research Northern Research Station in Edinburgh to develop a new prototype, which is one of the main contributions of Work Package 2 (WP2). The objective of WP2 is to develop an in-house Internet of Things (IoT) prototype to measure variables related to tree stress, such as sap flow, air temperature, humidity and soil moisture to be piloted using community/citizen science methodologies connected to web applications for data analysis, visualisation and sonification. Figure 1 shows a diagram of our vision.

Hackathon contributors
The hackathon contributors are:
- George Xenakis (lead of WP2’s vision)
- Luigi Marino (QMUL)
- Mahmoud B. Elmokadem (DMU)
- Subhash Arockiadoss (DMU)
- Ning Liu (QMUL)
- Stanley Raymond Parker (QMUL)
- Krishna Nama Manjunatha (DMU) (online)
- Ireti Olowe (UAL) (online)
- Anna Xambó (QMUL)
Aim of day 2
The aim of day 2 has been to create a hands-on hackathon space where we can share more ideas towards designing the DIY tree talker by both reflecting on Ireti Olowe’s talk and continuing the discussion about hardware and software. The day started with a hands-on demonstration of how the hardware prototype works led by Mahmoud B. Elmokadem and Subhash Arockiadoss. Then, George Xenakis did an outdoor demonstration of how to install a tree talker. This was continued with short project presentations by Stanley Parker and Ning Liu about their final-year projects to get feedback from the team. After lunch, we had a brainstorming session on audiovisual mappings. The session concluded with a discussion led by Ireti Olowe on the potential directions that the prototype could take. George Xenakis gave the closing speech. Next, we detail a bit more about the day and the key take-aways.
The node prototype
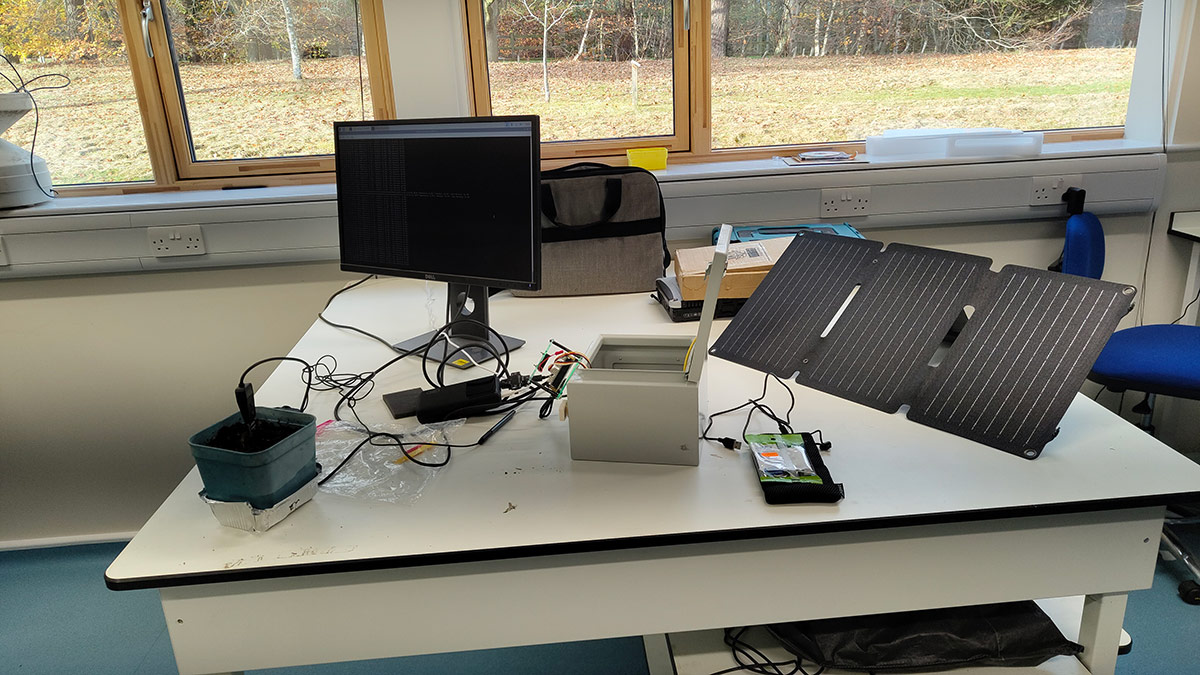
After the presentation of the node prototype on day 1, Mahmoud and Subhash started the day by showing us how to set up the system and how the system works in a lab for these purposes. George prepared a small bucket with watered soil to use the soil moisture. As we were unclear about the output values, we compared it with a standalone soil moisture. Subhash realised that putting the two together was not a good idea because it created a noisy signal. Mahmoud also said that the sensor takes some time to establish. George reinforced yesterday’s message of capturing with a lower intensity because the changes are slow. Mahmoud left the unit sending data for the entire day.
The installation of a tree talker
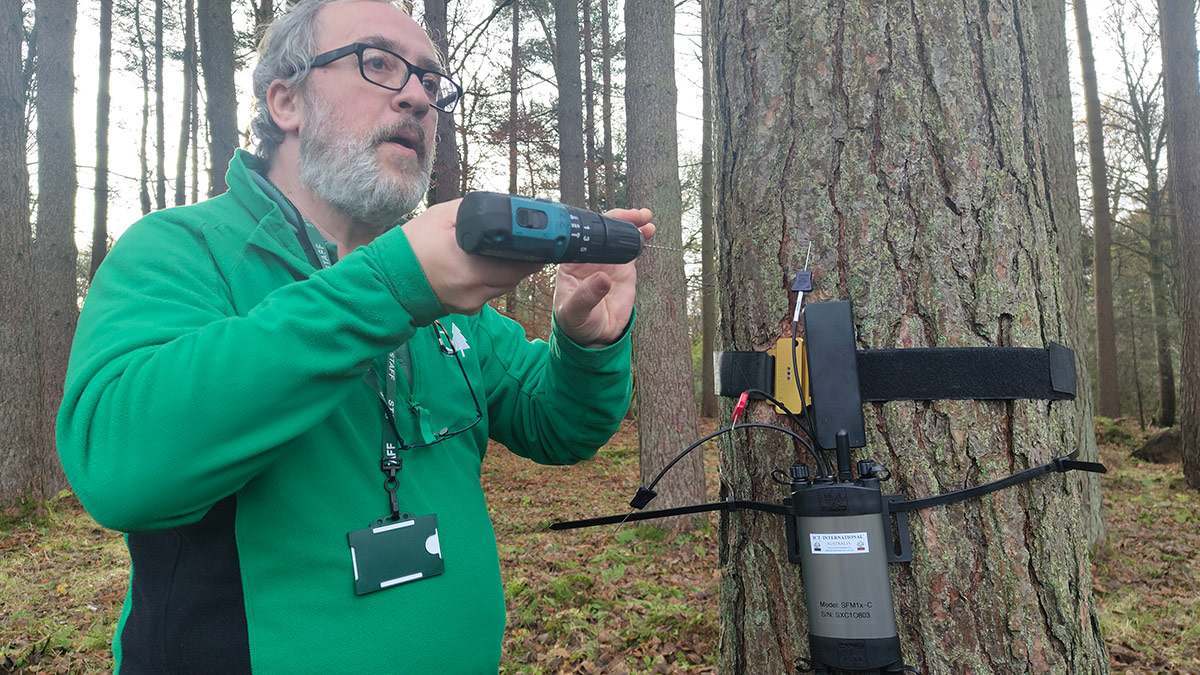
We then moved outdoors. George had prepared a unique demonstration of how a tree talker sensor is installed on a Scottish spruce tree. See below for the video demonstration that explores new and cheaper ways of data acquisition using known technologies. Mahmoud also took a series of portraits, which you can enjoy as a carousel at the top of this blog post.
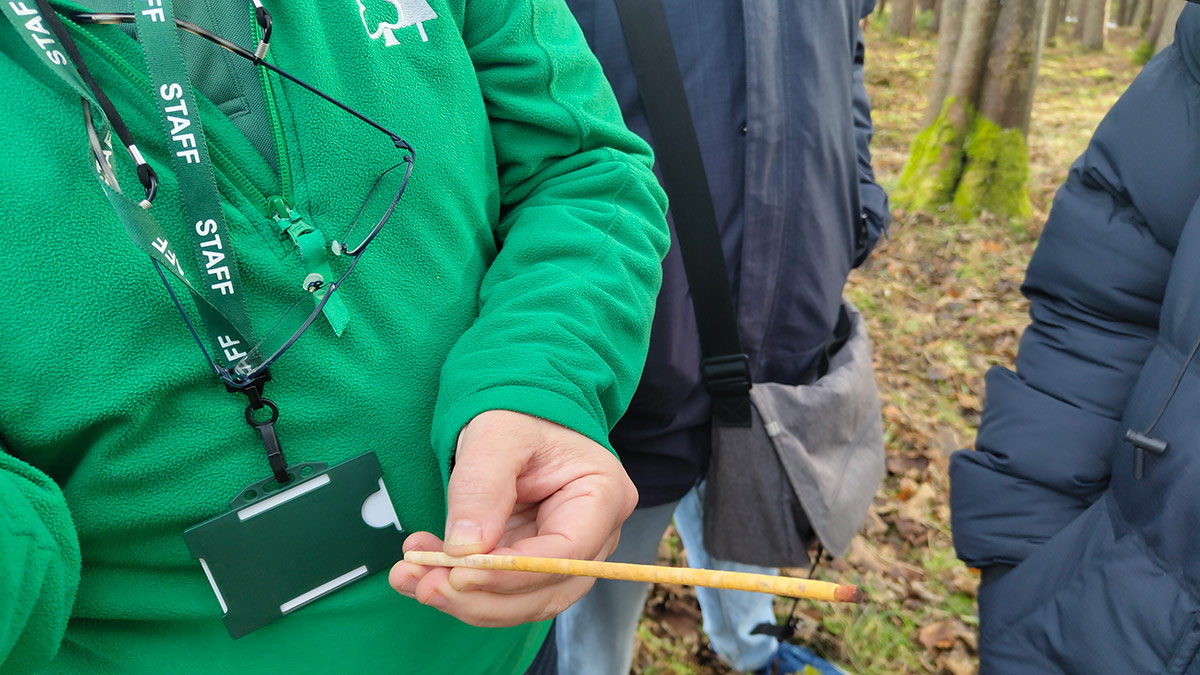
George also introduced us to the fascinating measurement object of the increment borer, which is used to extract a section of wood tissue from a tree to determine the age of the tree. It is possible to count the number of rings in the core sample and to infer the age of the tree as well as the growth rate.
Two related UG’s projects
Before lunch, we dedicated a session to hearing from Stanley Parker and Ning Liu about their final-year projects of their respective undergraduate degrees at QMUL. Stanley is a BSc Creative Computing student. He is creating an environmental monitoring module for his final year project. Ning is a final year student in BSc(Eng)FT Electronic Engineering(with BUPT). She is evaluating the quality of MEMS microphones to improve the audio quality of the streamers in silent conditions. Each of them presented informally their projects and had fantastic feedback from the team.
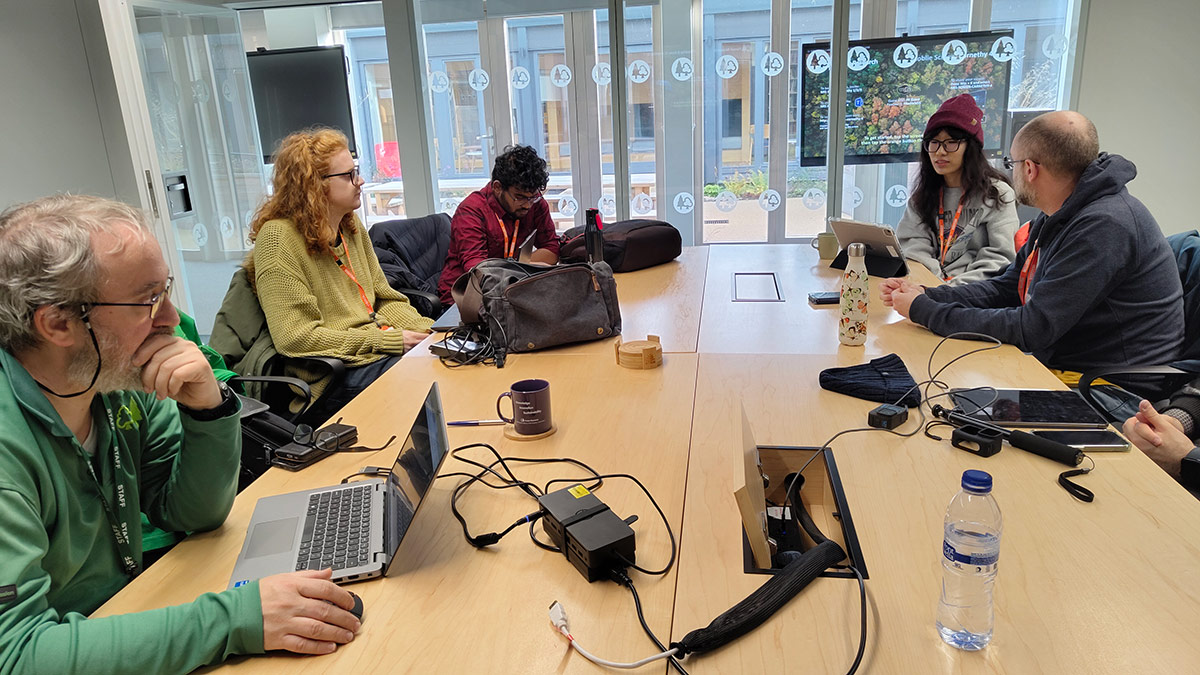
Brainstorming session on audiovisual mappings
Stanley Parker: An AV mapping example
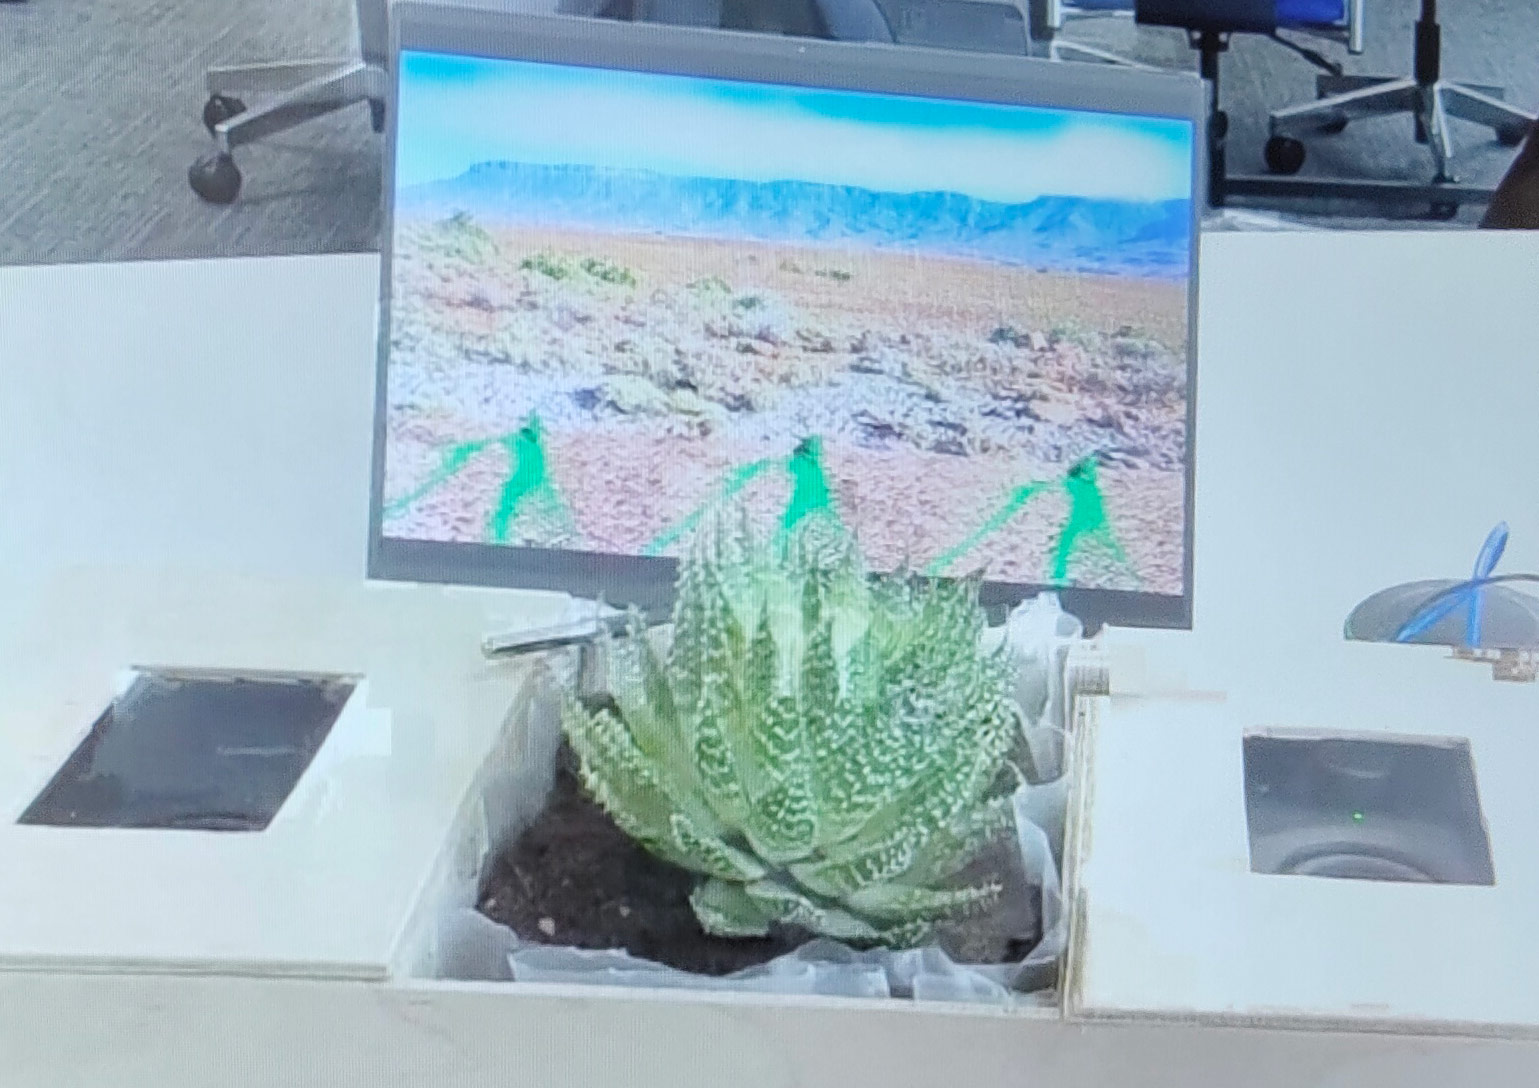
After lunch, we devoted a session to discussing what are the potential mappings. We started from existing examples. First, Stanley shared an audiovisual project he did as part of his degree about changes in the environment where a realistic landscape would change depending on the environmental and climate changes on a physical plant.
George Xenakis: A sonification example
Then, George presented the data that a sap flow generates and what is the type of plot that he used for the sonification. From the data, we could clearly see daily fluctuations of the sap flow expressed in litres per hour, where negative values would mean sap flow going downwards.
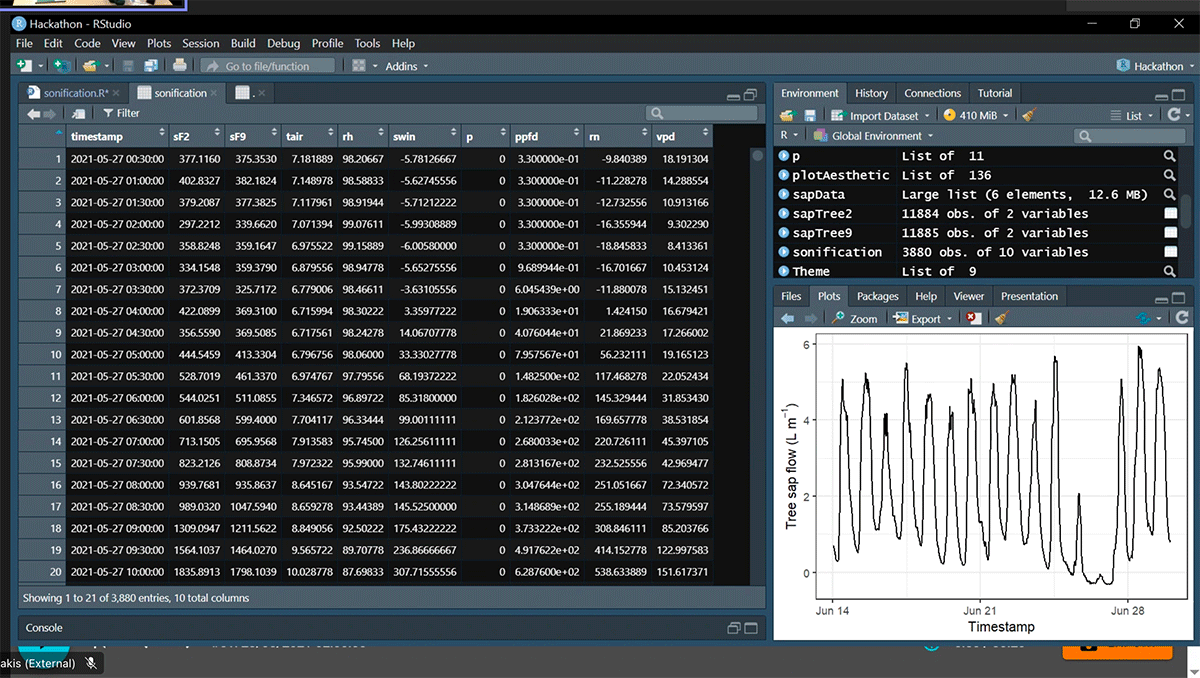
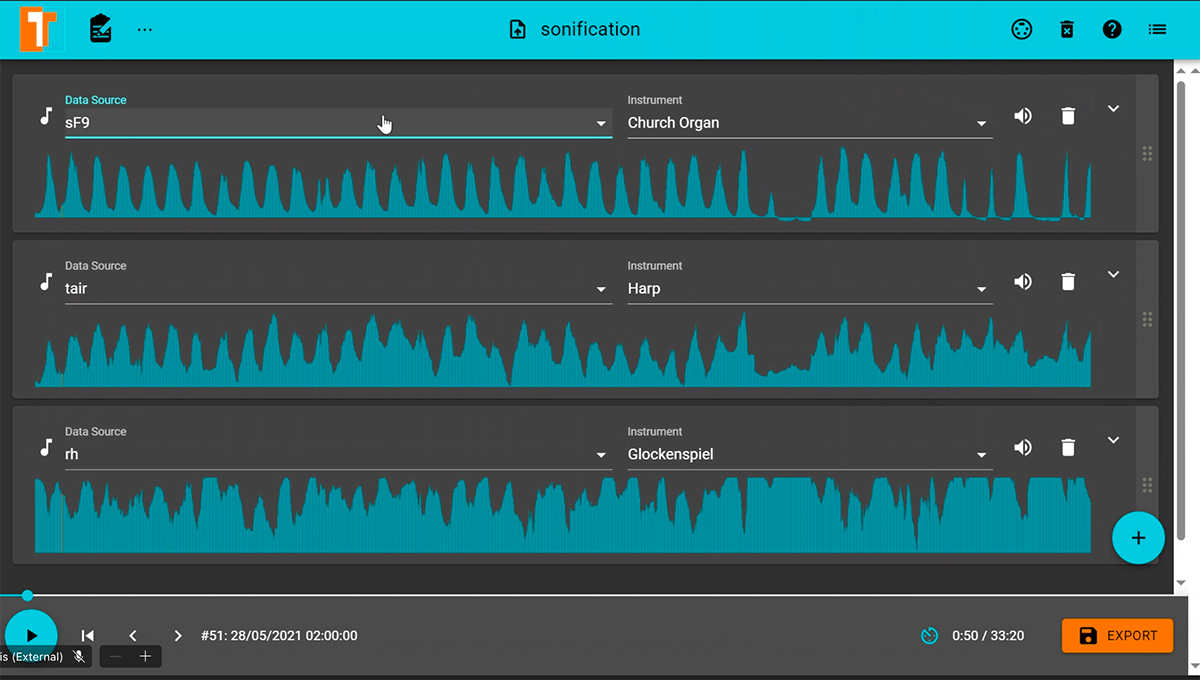
Then, George explains the process of sonification for his piece. The three variables used are sensor flow, air temperature and relative humidity (which measures water vapour relative to the temperature of the air). The tool used is TwoTone as shown in Figure 8. Existing relationships that we can observe are, for example, when there is high temperature and low humidity, the atmosphere is dry, which means the soil is dryer, and the tree starts getting stressed. George talks about an existing lag between changes in the atmospheric conditions and how they affect the tree’s sap flow.
The sonification is made by choosing one musical instrument for each variable. A church organ for the sap flow, a harp for the air temperature, and a glockenspiel for the relative humidity. When listening to the piece, we confirm from yesterday’s discussions that it would be useful to allow the user to mute/unmute the different instruments so that they can make the connections clearer.
In terms of visualisation, George would like to see the metaphor of the emotion of the tree by showing a face on the tree of when the tree is happy vs sad, perhaps emoticons. Happyness refers here to an optimal balance of temperature, humidity and soil moisture. For example, a happy face on a tree could be triggered when there is a high temperature and the soil moisture is high. On the contrary, a sad tree could be triggered by a lack of water. We also talked about how these correlations could translate from replacing the sap flow sensor with the dendrometer when replicating a few units for the forthcoming user study next year. In the case of the dendrometer, we measure the relative change to where you started, where the bigger the difference, the bigger the sap flow.
Subhash Arockiadoss: A sonification example
Subhash presented an example of NASA where they map the supernova to different colours. NASA’s Wide-Field Infrared Survey Explorer (WISE) is a mission that uses infrared light to scan the sky, capturing images of stars, galaxies, asteroids, and comets, among others. An example of how WISE ‘sees’ is explained in NASA’s blog post WISE Sees an Explosion of Infrared Light and An Explosion of Infrared Color.
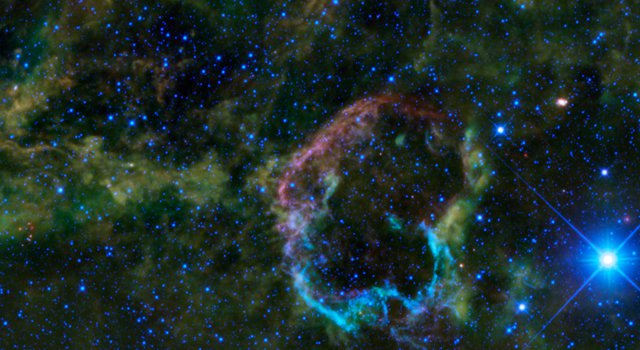
Here we see the representation of the explosion of the star IC 443, 5,000 to 10,000 years ago, to then die. When a massive star dies, it provokes blasts, which are called supernovae, and it sends out shock waves, which in turn create supernova remnants. In Figure 9 we see the infrared light color-coded to reveal different densities of the materials from the infrared wavelengths of the shock waves hitting the materials.
Luigi Marino: Considerations on mappings
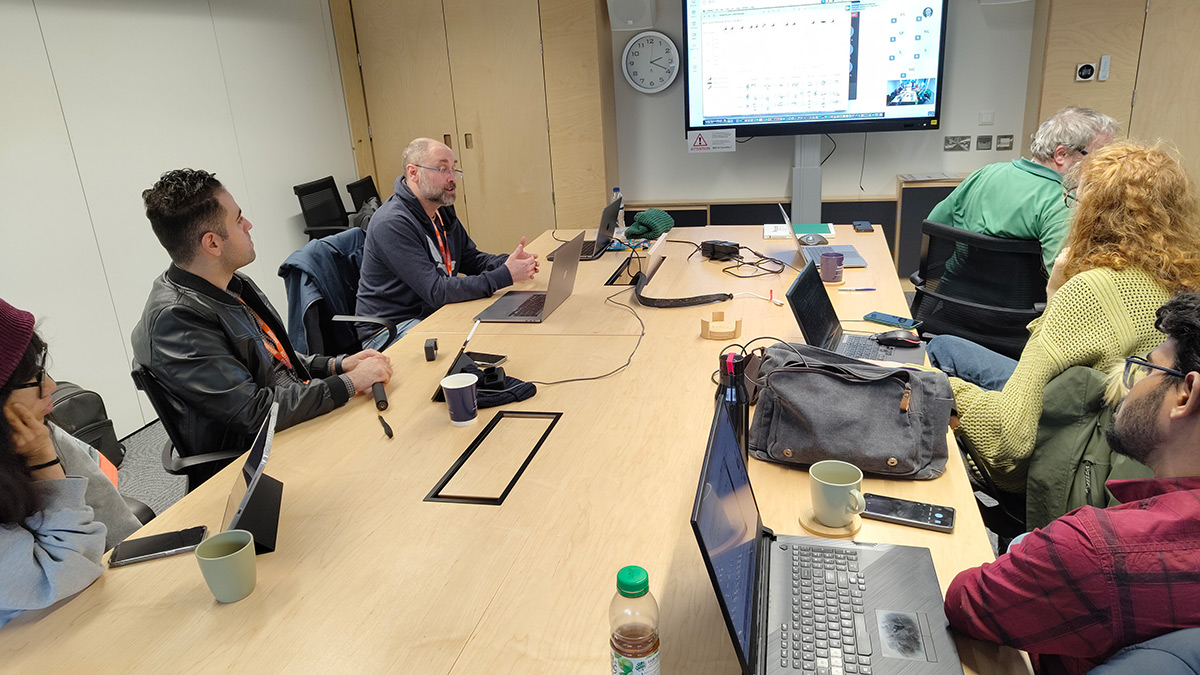
Luigi gave a theoretical overview of mappings based on his PhD work Revisiting a relational approach to Electronic music performance (2021). He recognised that it is not possible to summarise in 15 minutes the history of mappings in electronic music that started in the 1960s, but he will focus on relevant aspects. Luigi mentions the continuum seen in the examples previously discussed from realism (Stanley’s and George’s examples) and the interpolation of data (Subhash’s example). Luigi recommends observing the phenomenon and forgetting any preconceptions. He then shows a few examples between arbitrary and the real world.
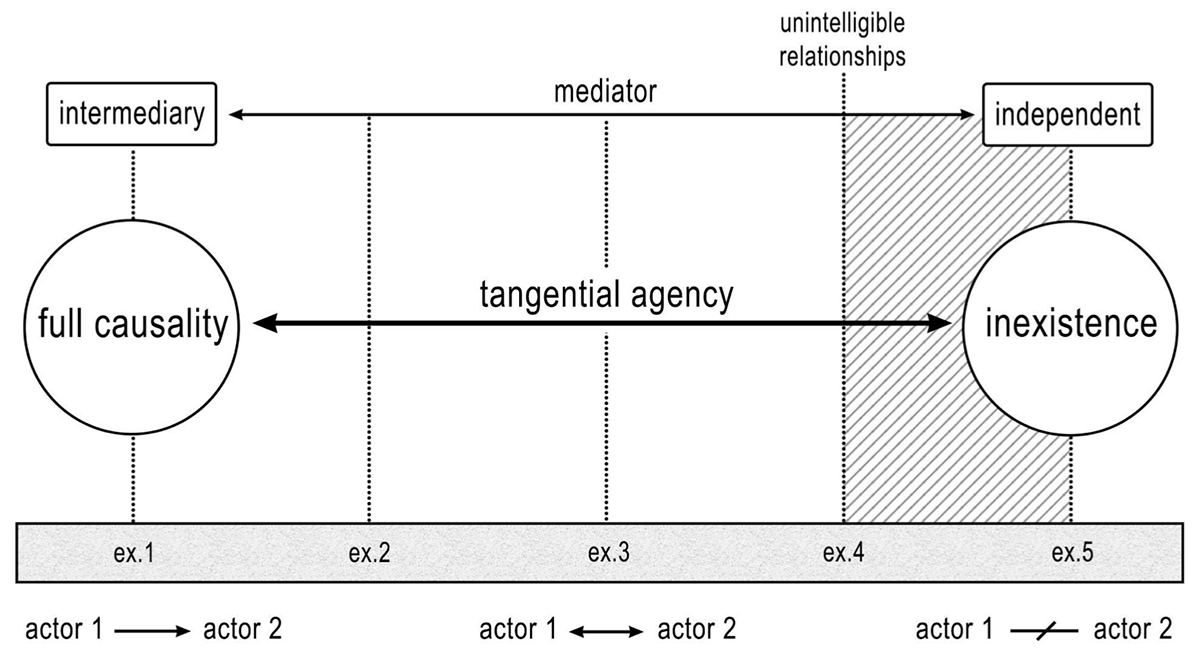
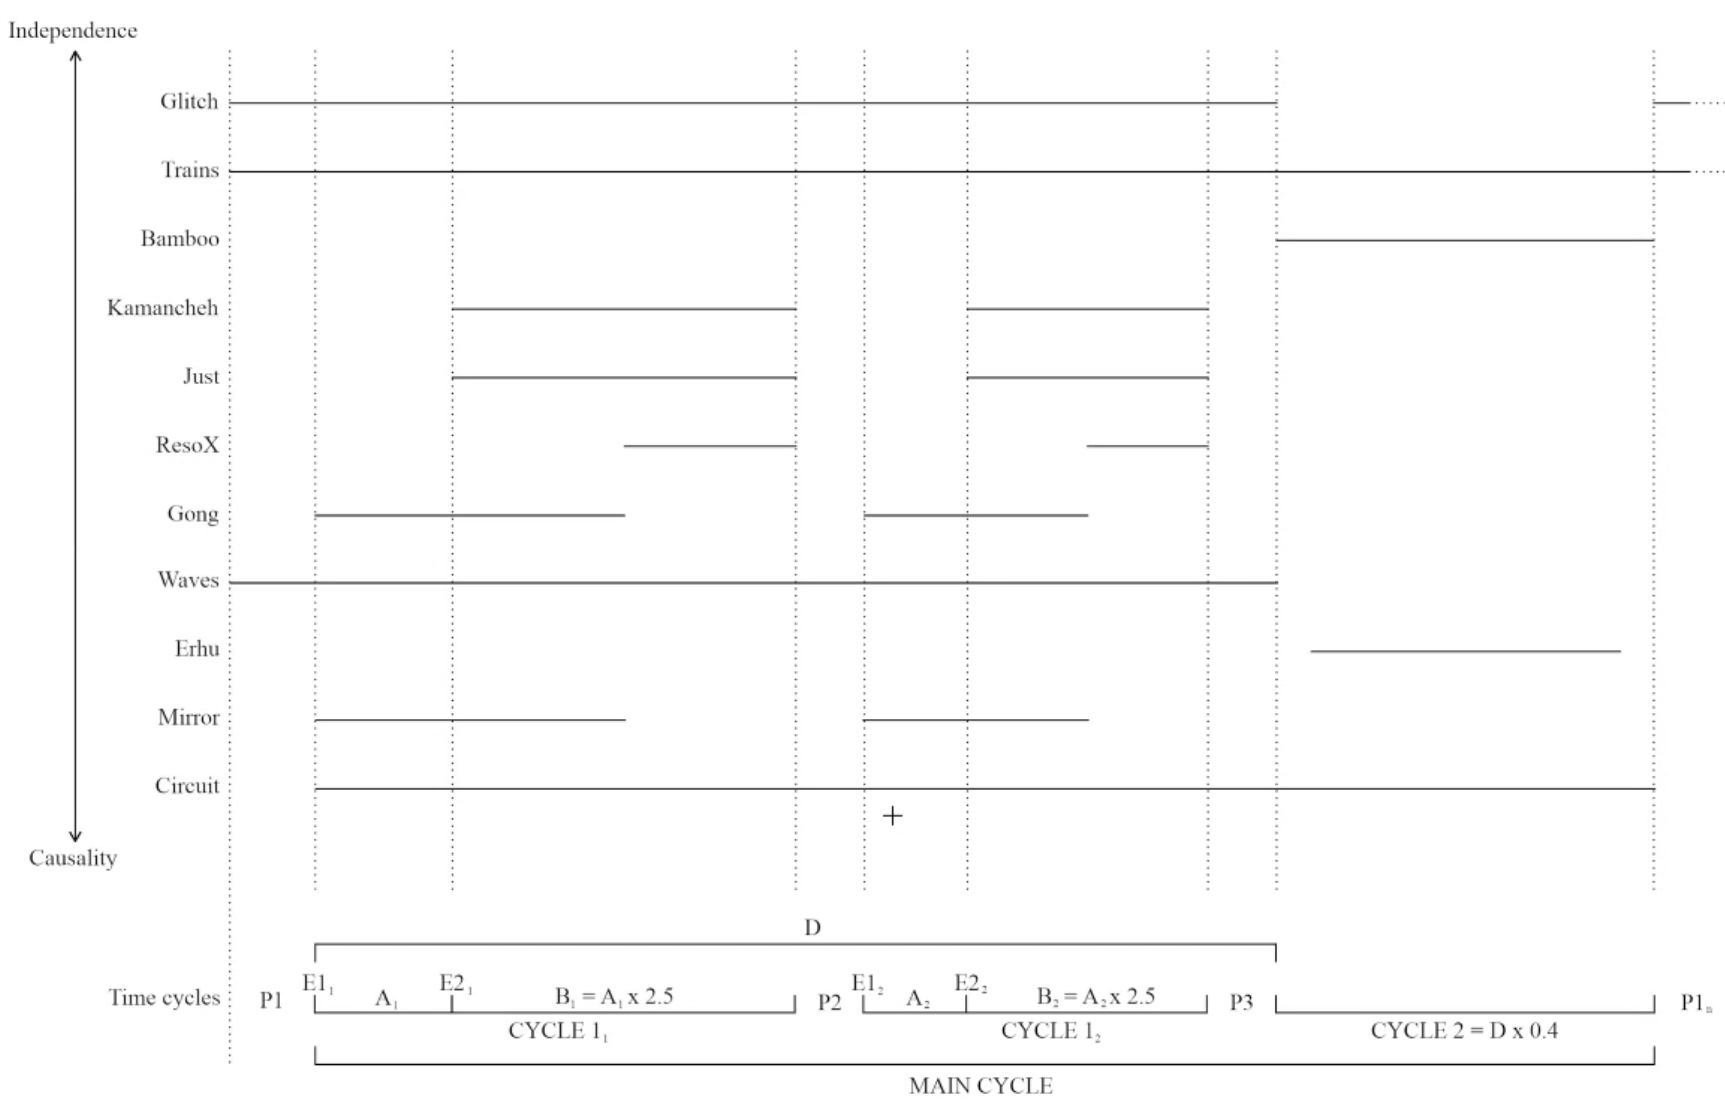
The first example is the composition of music from a bird feeder. Luigi talks about generative sound and animal science as areas that inform this work. This composition focuses on the anomalies of the signal and plays with different continuums e.g. short-term memory vs long-term memory or natural timeframe vs reactive artificial timeframe. Luigi proposes that for a full experience, you need to incorporate both full causality and inexistence, a quote he refers to from Bruno Latour on p. 101 of his thesis: “There might exist many metaphysical shades between full causality and sheer inexistence”. Luigi talks about this continuum and how tangential agency goes in line with this continuum where different shades of mediation are possible.
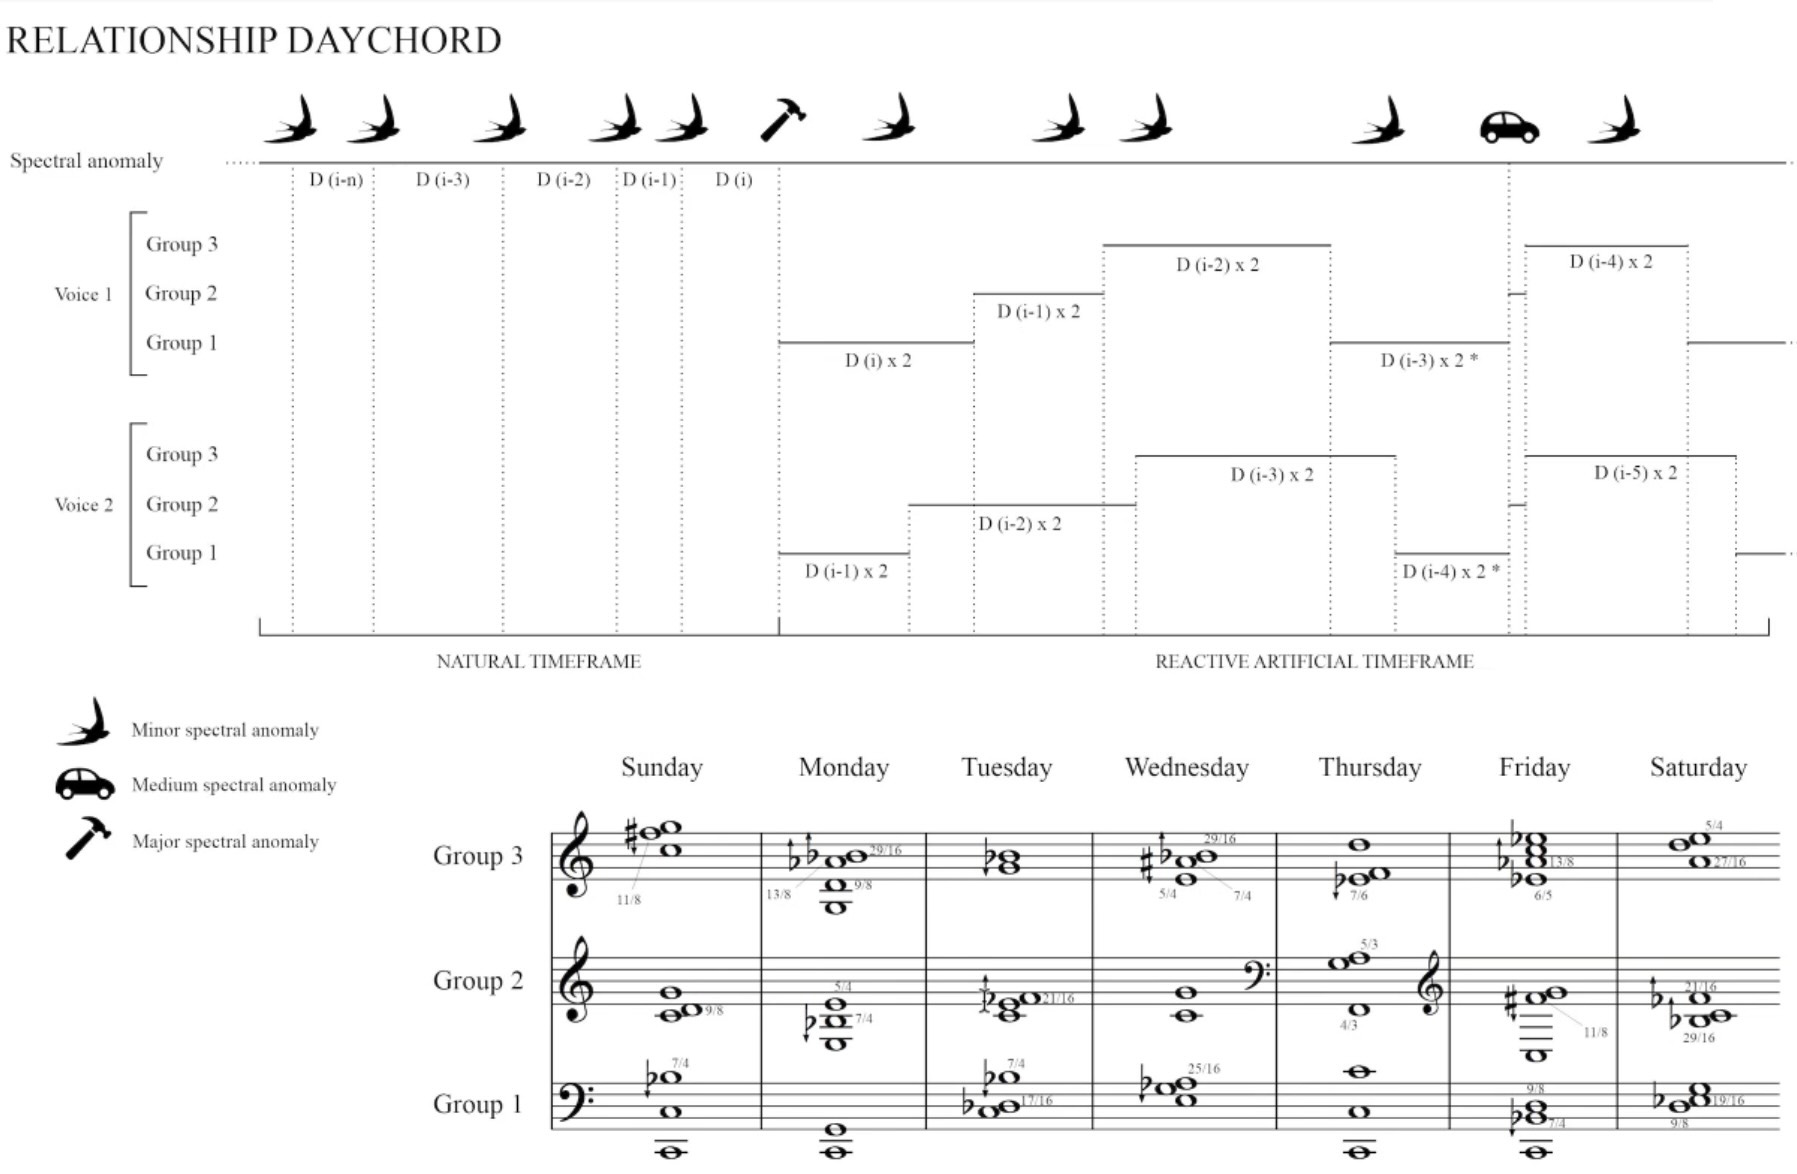
Also from his PhD thesis, Luigi presents a second example of a graphic representation based on relationships and tangential agency. Figure x shows, from top to bottom, how tangential the relationships are to the gestures of the performer. At the bottom, there is a representation of time in time cycles. Overall, Luigi recommends promoting surprises vs static behaviours e.g. looking at Subhash’s supernova example, every day we could see a different colour palette, or include some noise/artefacts for variation, which is extremely important in music.
Discussion with Ireti Olowe
While we had the brainstorming discussion, we circulated a white paper with three interconnected bubbles, data, sound and visuals, for each individual to fill in. This drawing was the starting point of our discussion with Ireti, who chipped in to act as an opponent role to our ideas.
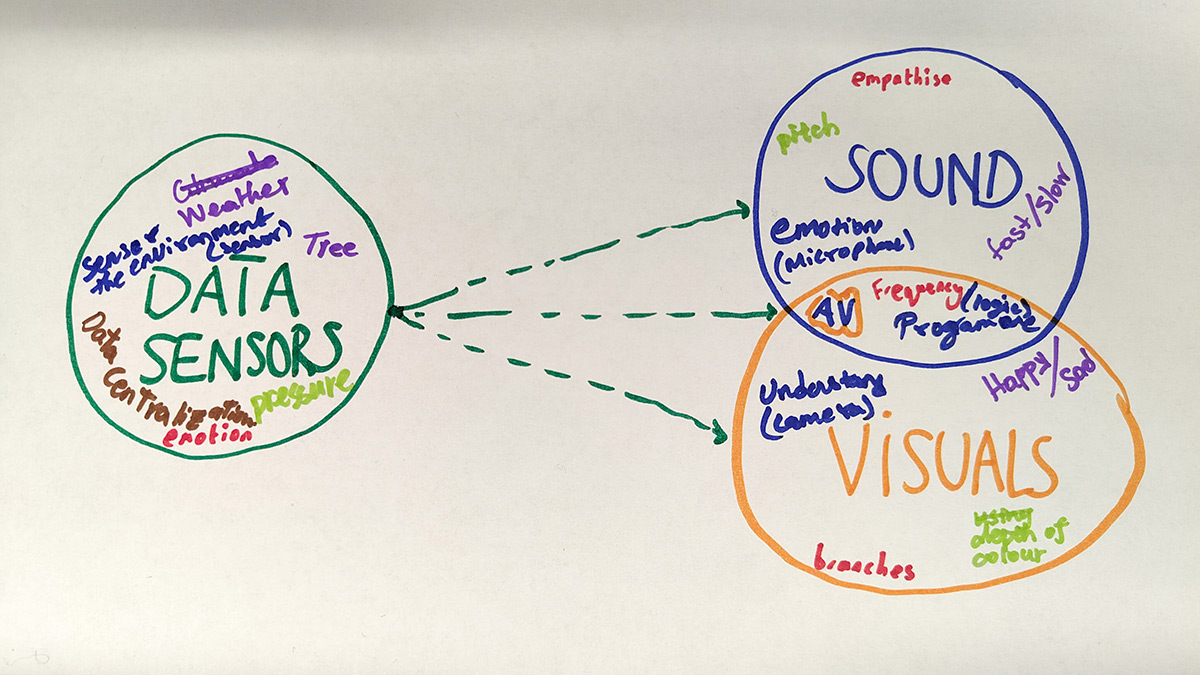
Our summary to Ireti was that we could not finalise the prototype, but we had a direction. We agreed that our starting point is the tree and its ecosystem, which always has feedback, that we want to build a narrative around it, and that we would like to offer a web-based interactive experience that should give ownership to the user. We also said that we are interested in observing patterns (not only data points).
Some application features that we discussed are:
- Ability to play with the data and listen to it.
- Support “plluralism” in terms of designing for a diverse range of users.
- Empower the user by switching on and off different layers.
- Support data inference and data interpolation.
In terms of metaphors:
- tree emotion, what is happy for a tree?
- network or cloud (no node can take over another node) with potentially many-to-many mappings
- nature
As per mappings:
- Work with continuums e.g. tangential agency (causality-independence), figurative vs abstract, musical vs sonic.
We all agreed that representing the connection between trees and climate change is very difficult, and it is the quintessence of the Sensing the Forest project. We should keep exploring and discussing interdisciplinarity to succeed in this challenge. Ireti has provided us with many examples that we can dig into and start finding more concrete representations we can get inspiration.
Collecting data from the node
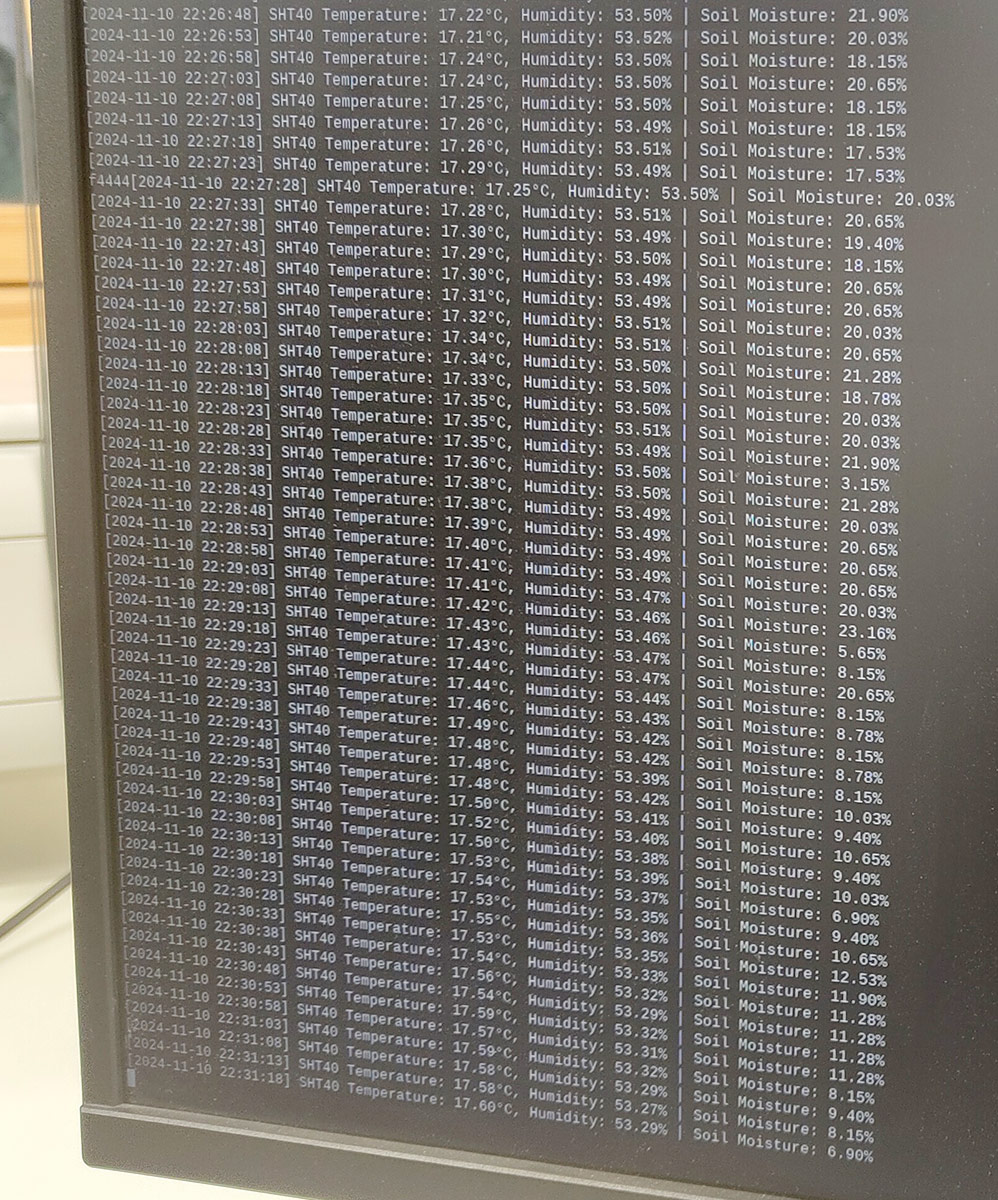
The final part of the day was to check the data collected by the node prototype. It was a success to see that the node was still collecting data and that the soil moisture sensor had stabilised by giving more correct values than in the morning. Figure x shows stable values from the temperature sensor, humidity sensor and soil moisture sensor. George suggested again that adding a switch on/off can help with the efficiency and stability of the data collected and values and that reducing the frequency might also help, for example, every 10 minutes instead of every 5 seconds.
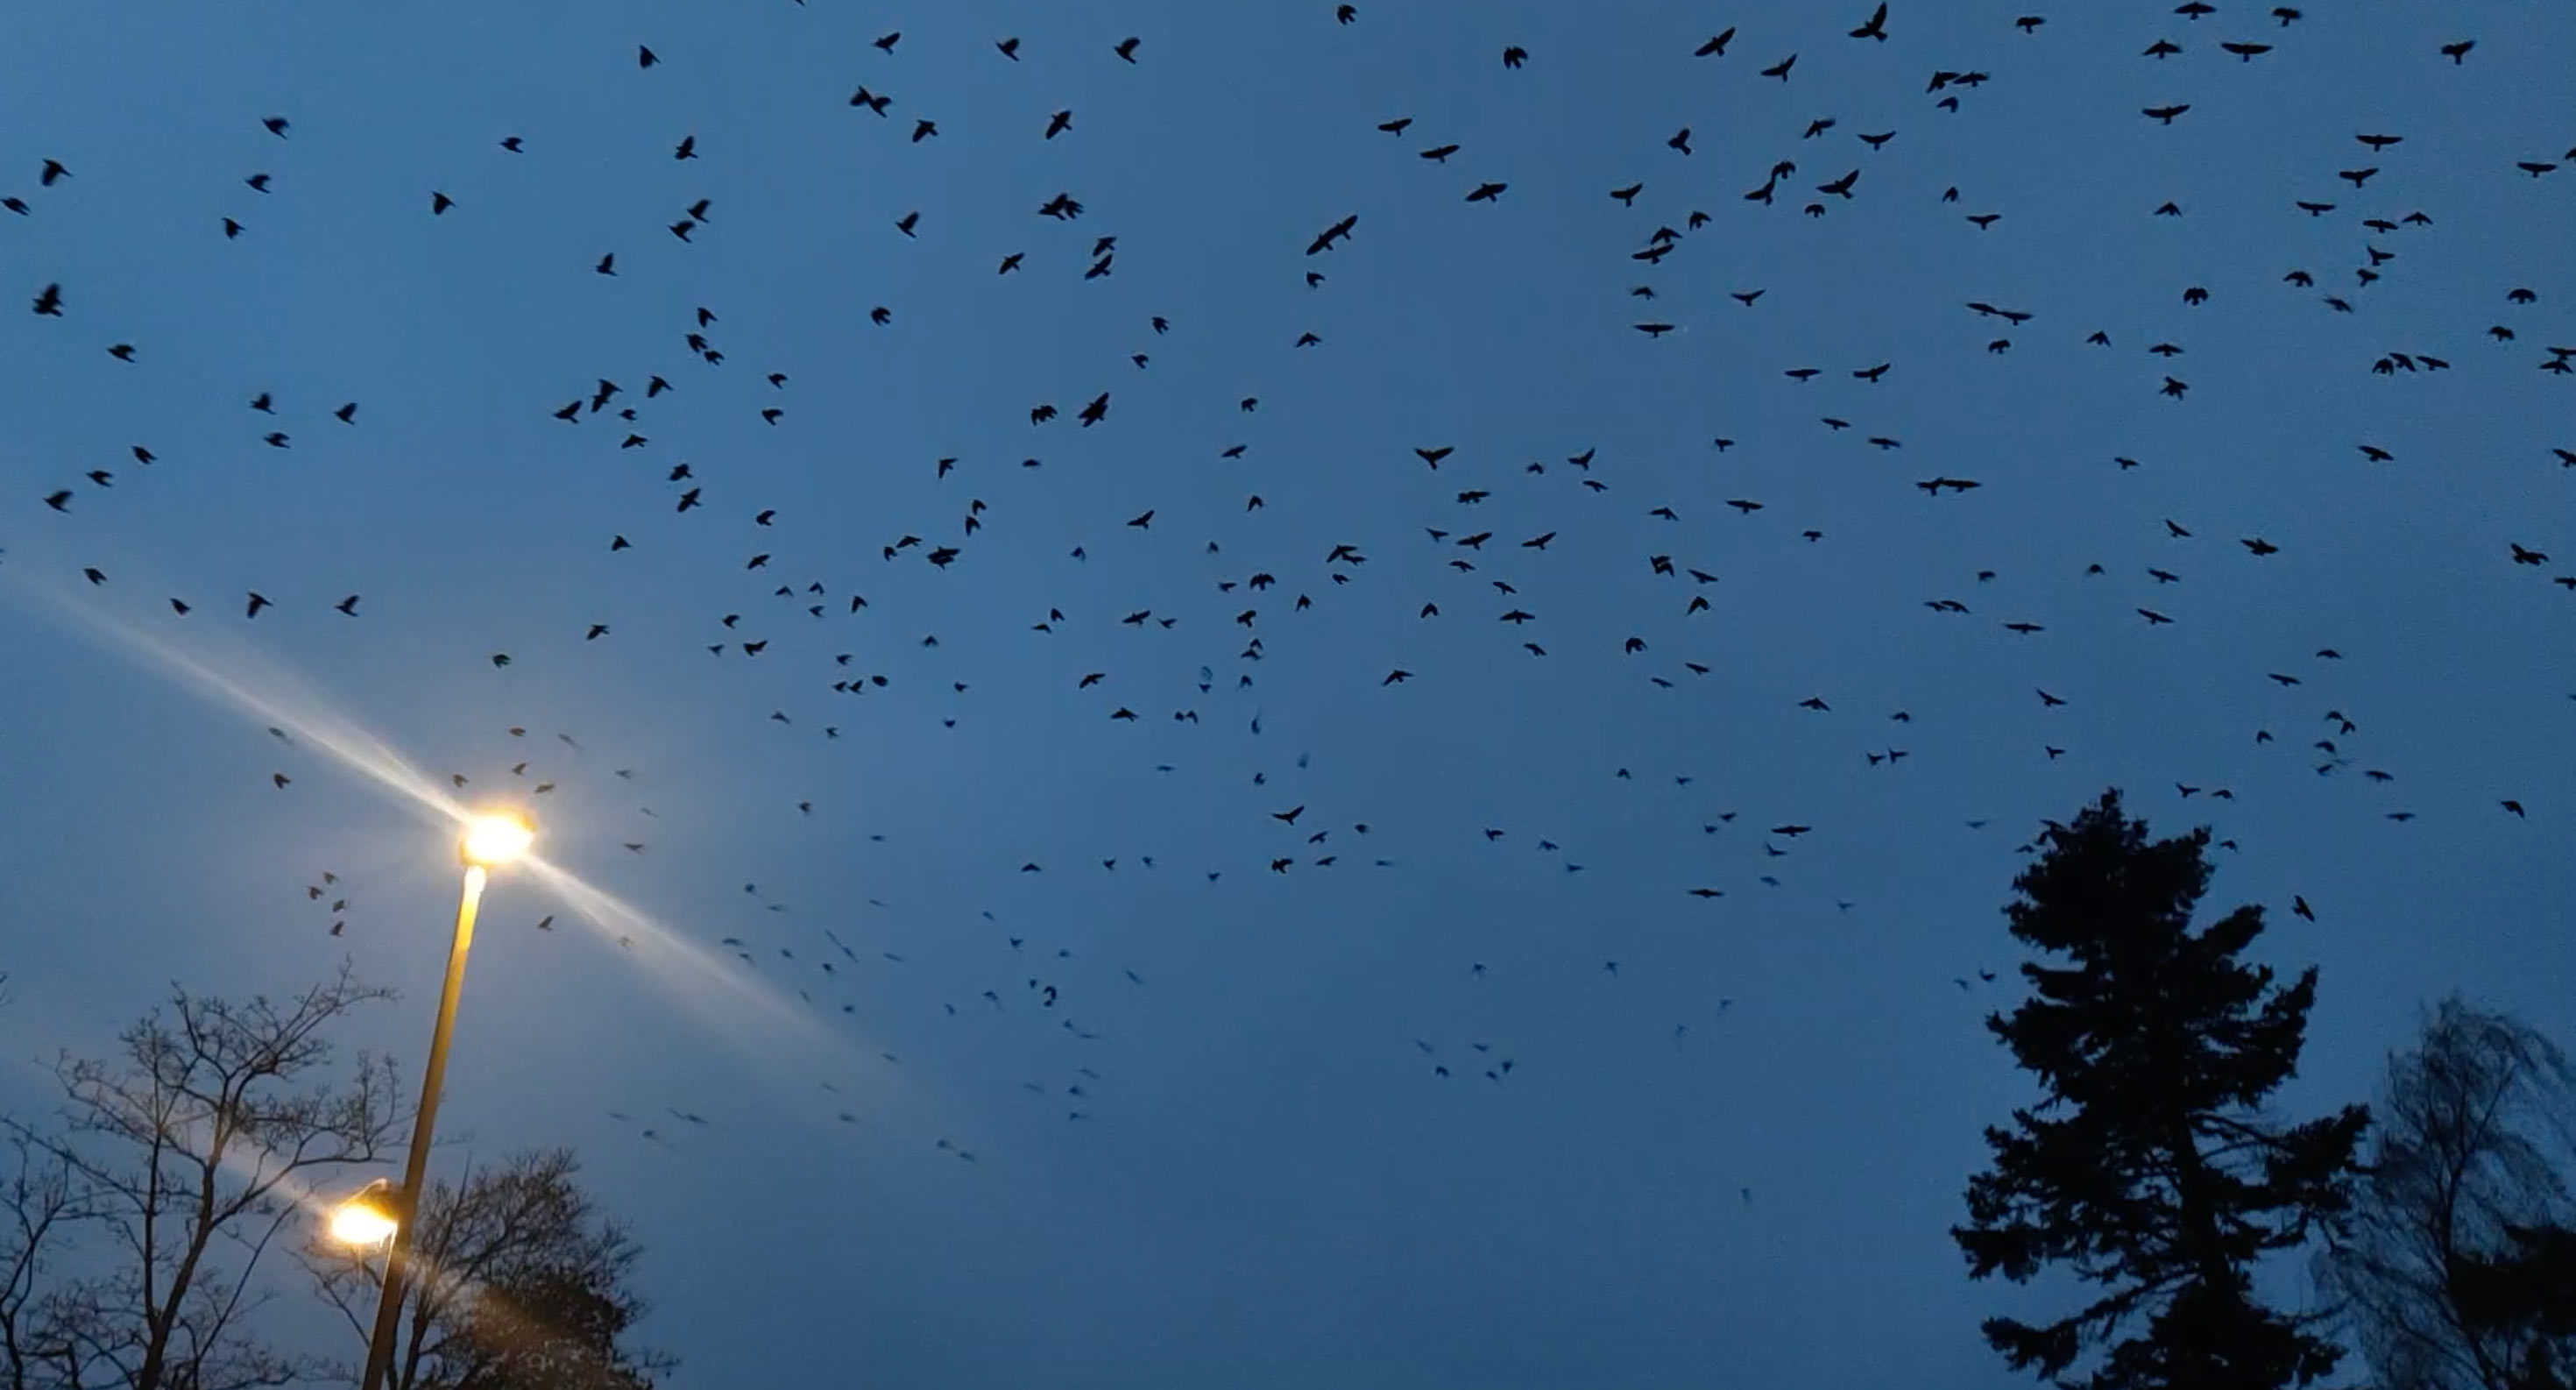
We left Forest Research Northern Research Station exhausted but very happy with how the two days went. A starling swarm said bye to us with an audiovisual immersive experience of random but coordinated behaviours that exemplifies how we could approach the AV mappings for the prototype.
Dinner
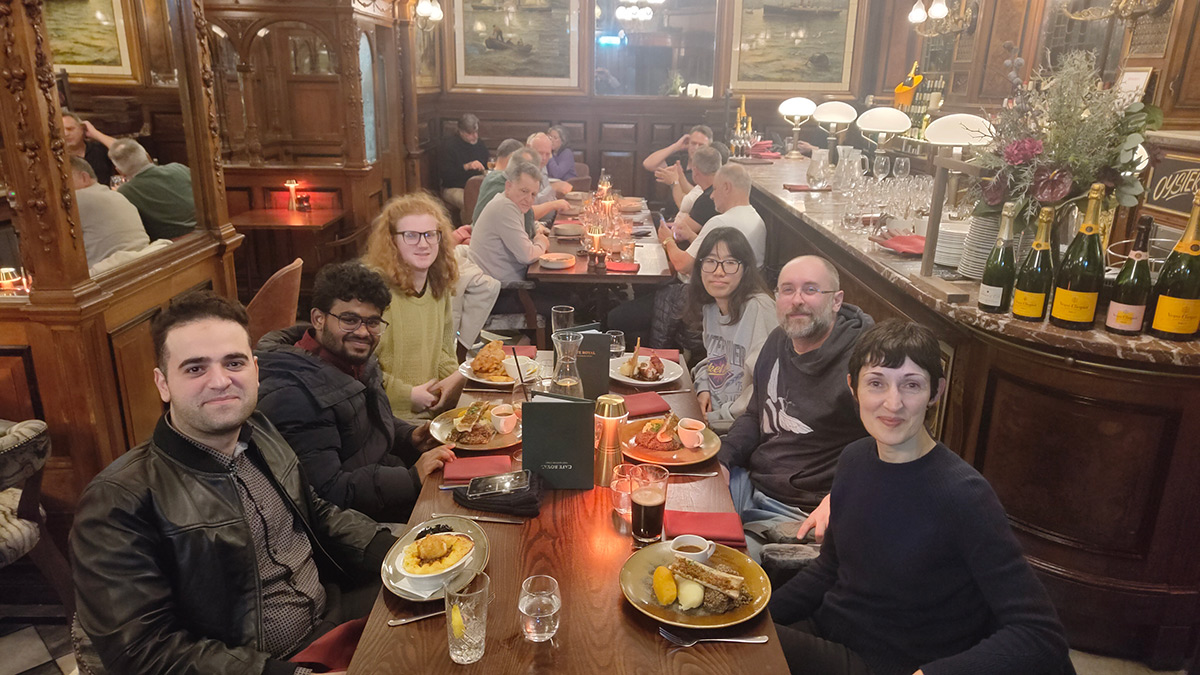
We concluded the 2nd day of the hackathon at Cafe Royal in Edinburgh for dinner. Many of us experienced the haggis for the first time and other well-elaborated dishes.
What’s next
Overall, working with a focus for two days has proven to be very productive. Although we have not been able to solve the problem in such a short period, we now understand better the different disciplinary perspectives that will help us to take the next steps. The group discussions have been fundamental for polishing the system’s requirements and outlining the next steps. Moreover, the hackathon has been a fruitful space for potential future collaborations.
Acknowledgments
Thanks to Forest Research for hosting us during these two days and to the team for the effort and contributions to the hackathon.