Dendrostream - Exploring Audio-Visual Approaches to Enhance Tree Stress and Climate Data Understanding
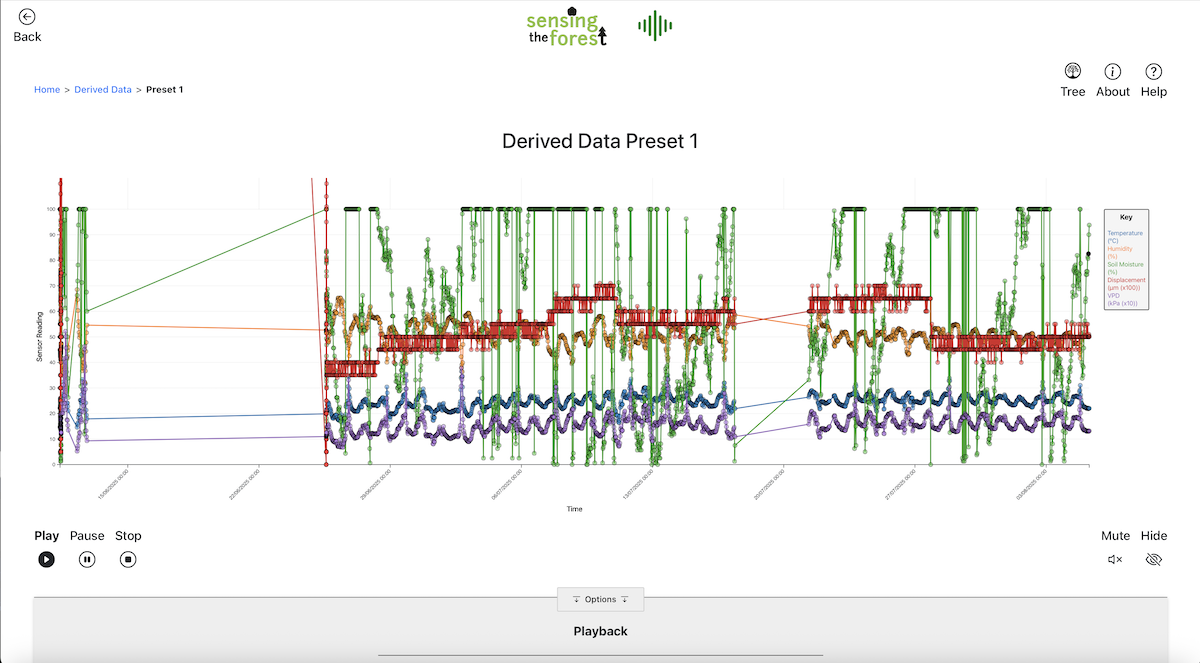
📷 Top photo: Screenshot of the Dendrostream Derived Data Preset 1 line graph sensor data using D3.js with temperature (blue), humidity (orange), soil moisture (green), displacement (red), and VPD (purple).
Introduction
Tree and climate data is often presented in scientific ways, such as complex charts, or with sensor measurements that are hard to understand without specialist knowledge. However, climate change, tree growth and stress, and the links between both, are important to all, and more non-experts are becoming interested in learning about the wider effects of a changing environment.
Dendrostream aims to bridge this gap, discovering suitable means of data presentation and analysis, to allow the public to interpret this traditionally complex data. Displacement (tree trunk expansion), soil moisture, air temperature, and humidity, captured from a DIY tree talker device is presented in charts, dials, and animations, with accompanying drone, frequency modulation (FM) synthesis, and musical data-to-sound mappings.
Design and Development
To develop a tool for data understandability by the broad demographics of the general public, five participants from diverse backgrounds were consulted throughout the project. A combination of surveys and interviews were used to identify the participants’ existing understanding of the data, views on features they would like to use within a created tool, and to validate the initial sketched designs. This feedback influenced the final developed web-based tool, produced using React and Bootstrap (frontend), Express.js (backend), p5.js (animations), d3.js (charts), and the Web Audio API (audio), subsequently evaluated by the participants.
Audio-Visual Presentations
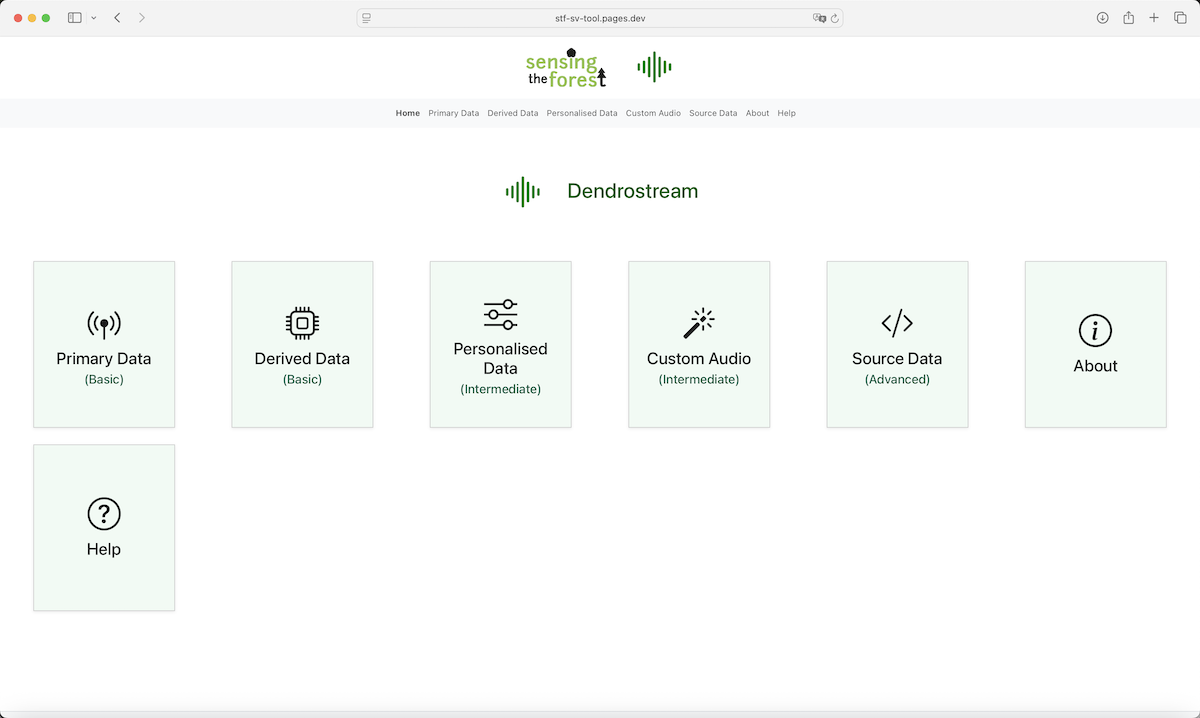
Dendrosteam offers two main routes of audio-visual presentation: presets and custom/personalised. Presets offer simple ways of interacting with the data, to easily understand key concepts, whereas personalisation allows users to delve deeper into the data, and tailor their presentation to their interests or learning preferences. The main presentations are listed below:
Primary Data → Below presets presenting raw sensor values: displacement, soil moisture, air temperature, humidity.
Derived Data → Below presets presenting raw sensor values alongside additional calculated/inferred data: vapour pressure deficit (VPD), tree mean growth.
Preset 1 → Audio: drone sounds; Visuals: line graph.
Preset 2 → Audio: drone sounds; Visuals: tiled line graphs (data comparison).
Preset 3 → Audio: FM synthesis tones; Visuals: daily averaged bar chart.
Preset 4 → Audio: musical instrument ensemble; Visuals: data dials.
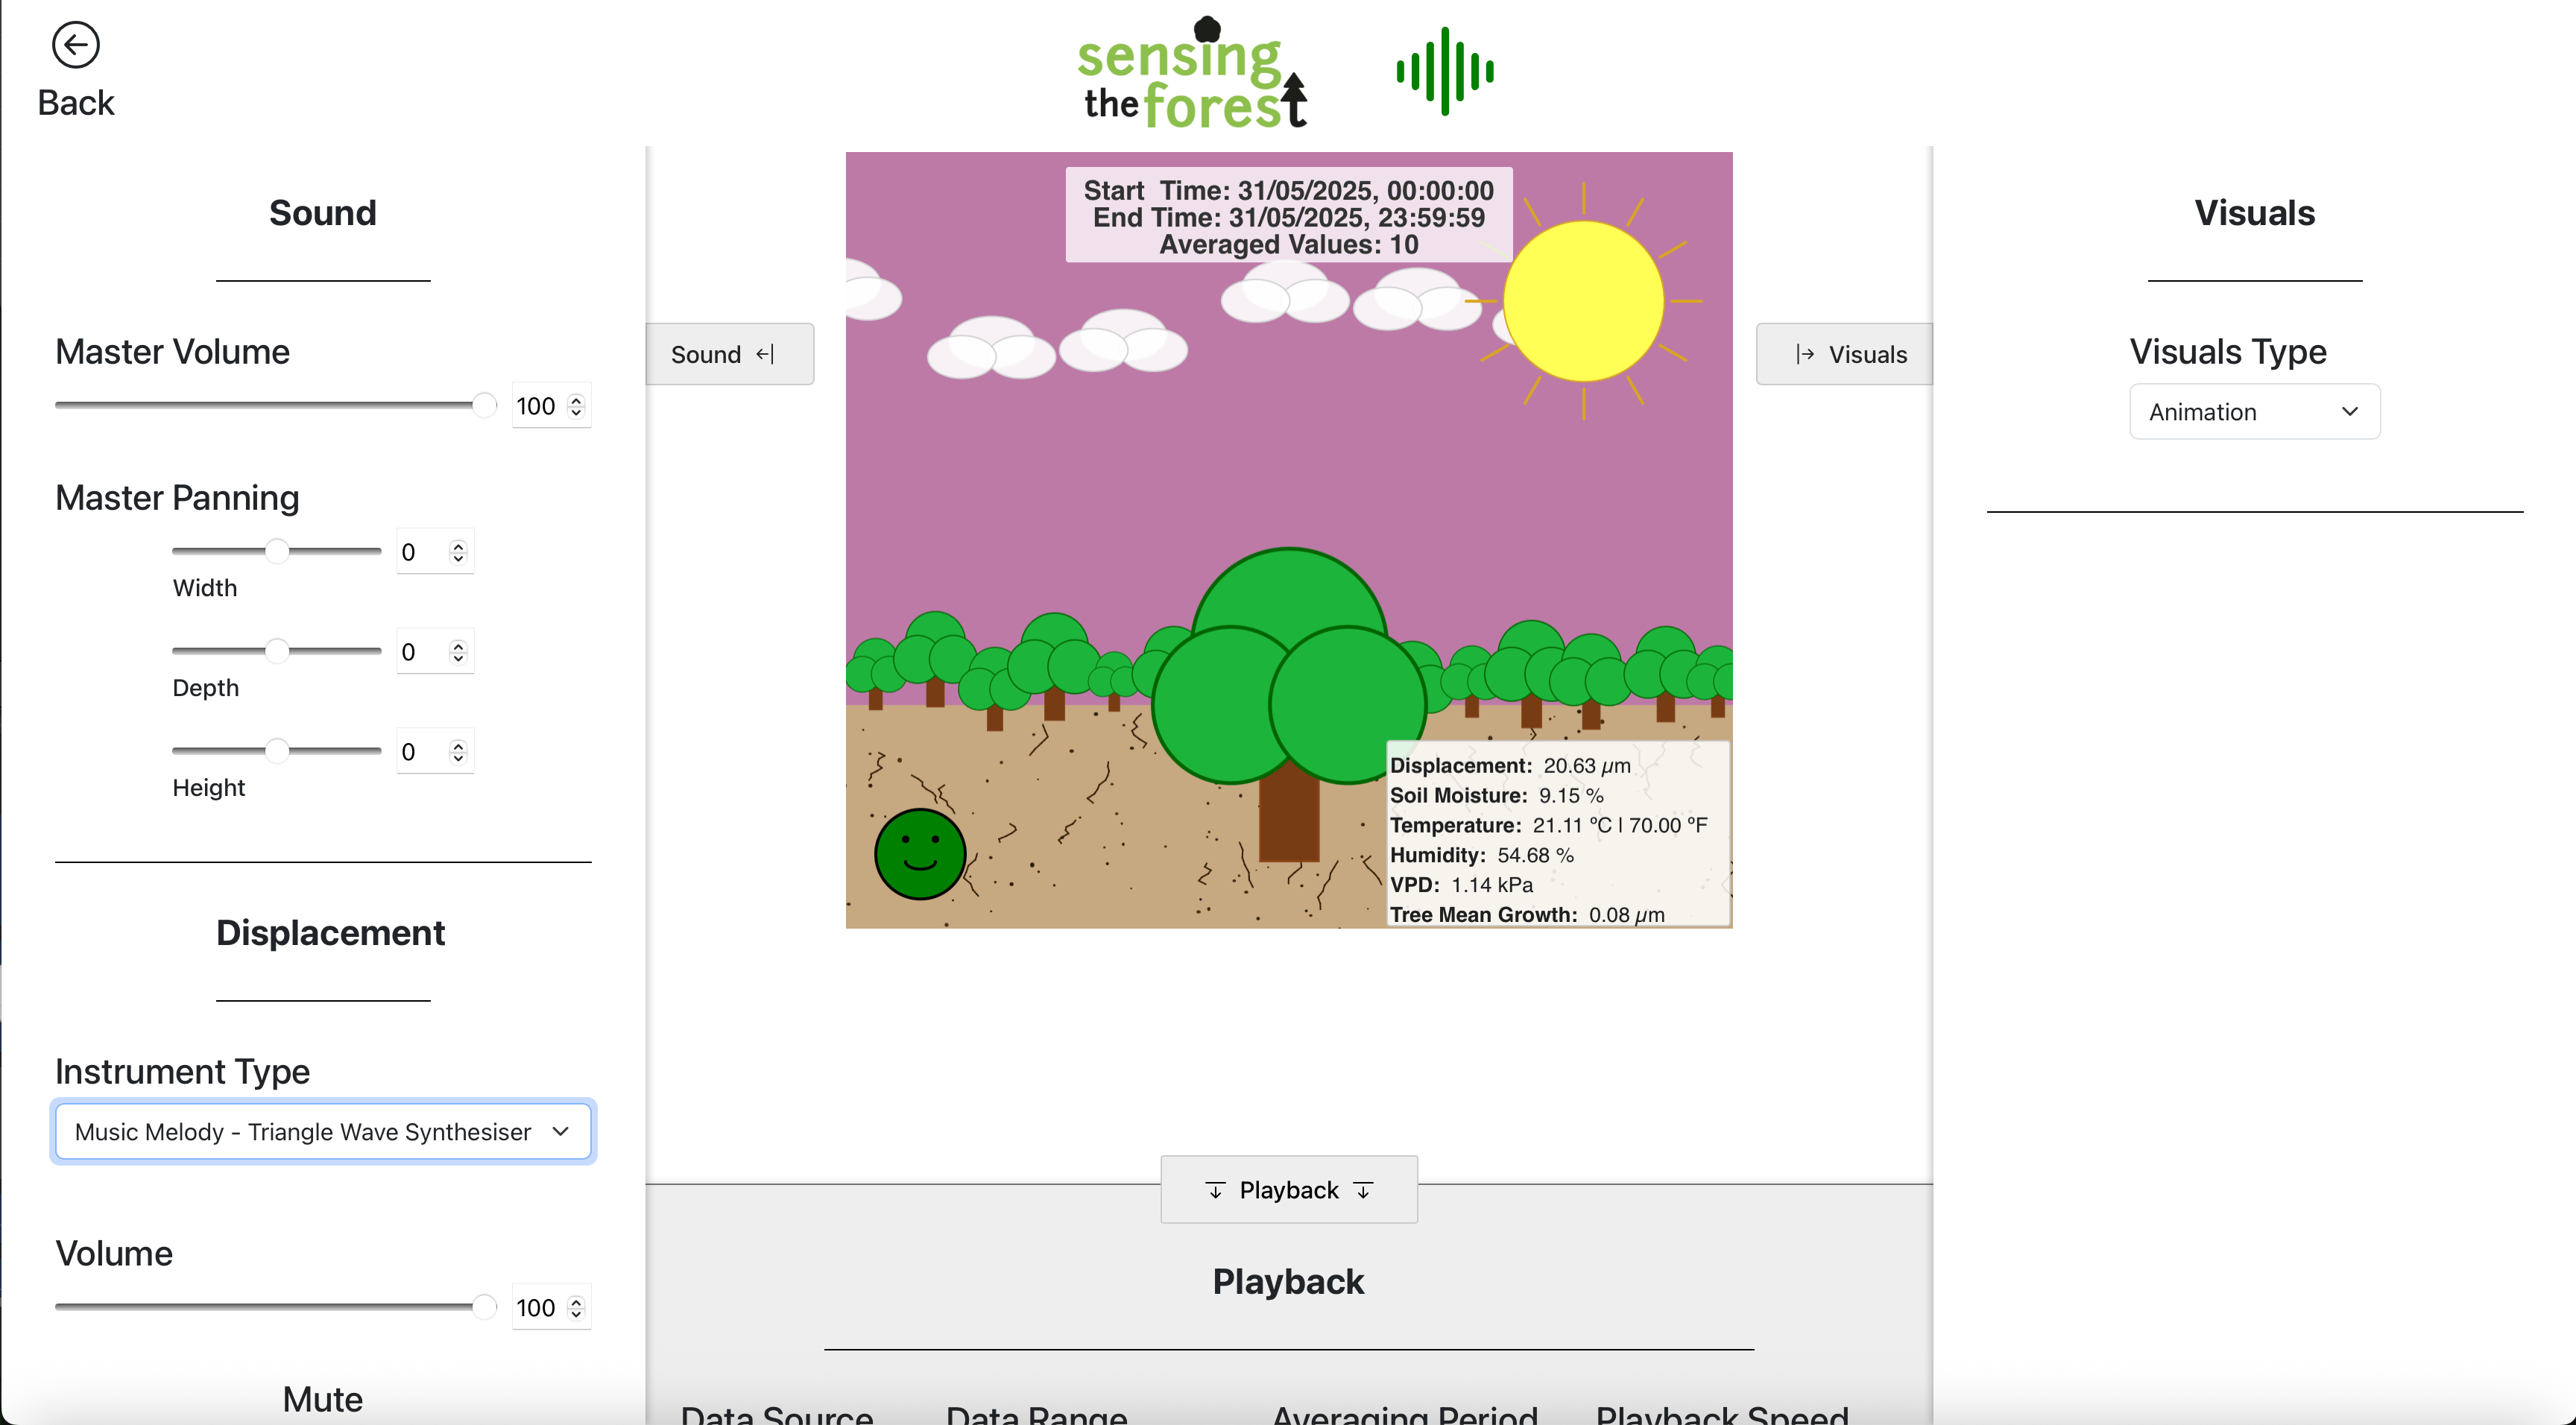
Preset 5 → Audio: music with ambient sounds; Visuals: forest animation scene.
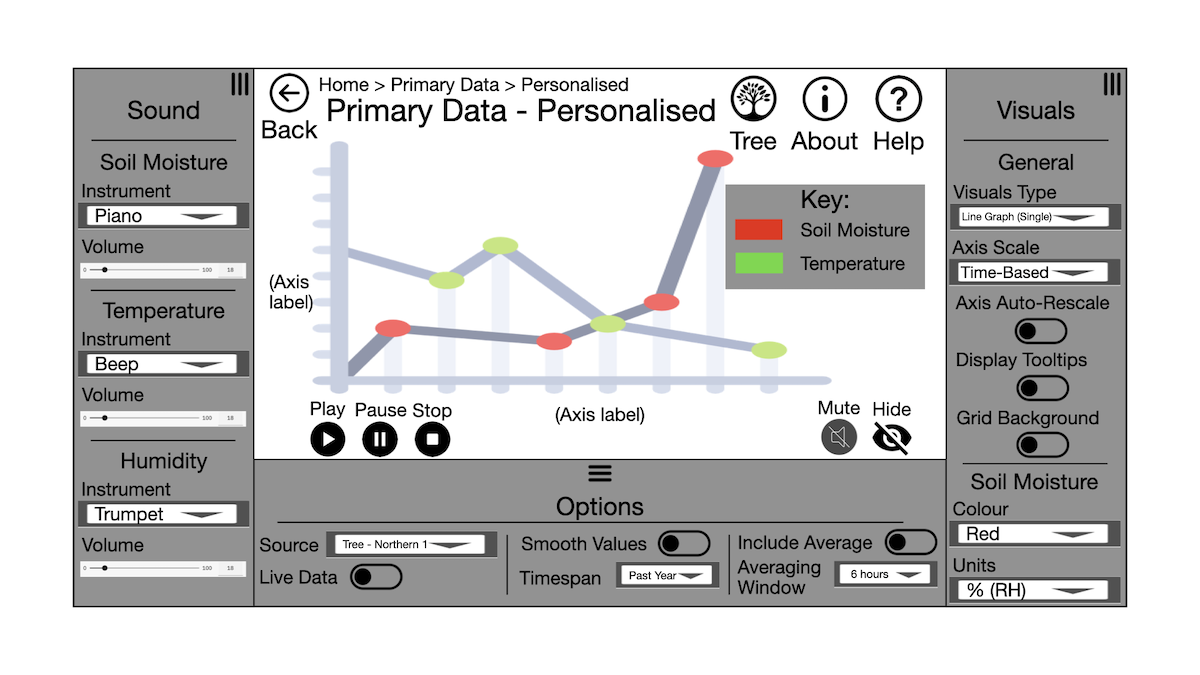
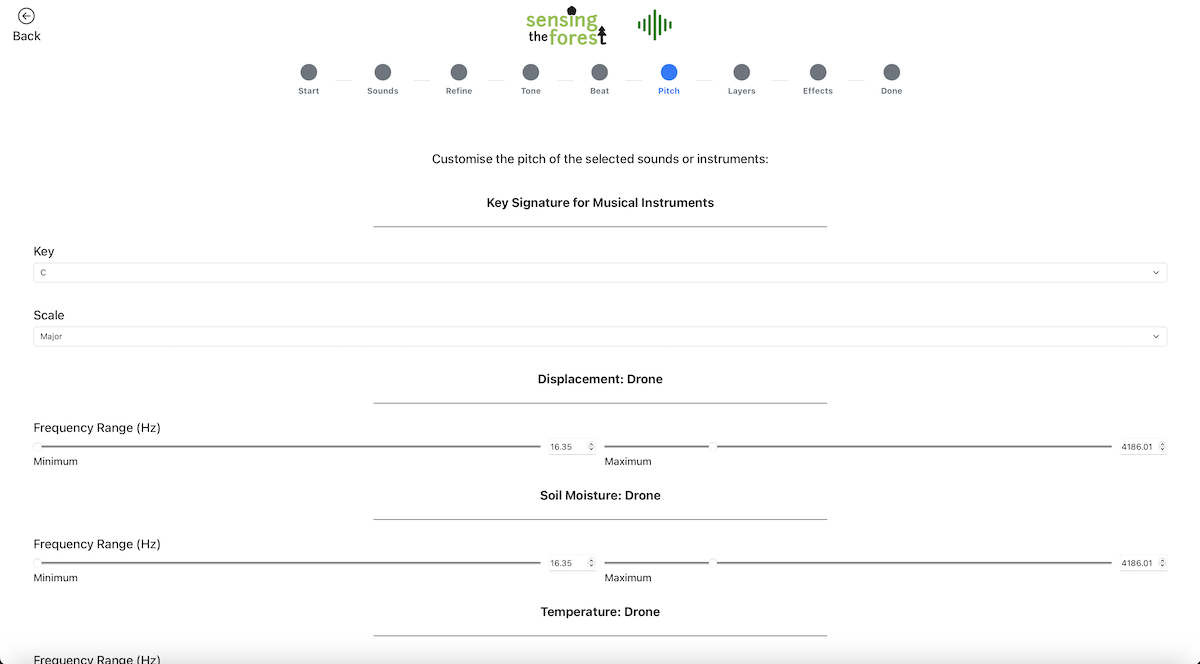
Personalised Data → Any combination of audio/visuals listed above, with additional customisation options.
Custom Audio → Any combination of audio per data variable listed above, with additional customisation options.
Source Data → Raw sensor data (JSON REST API or file download).
Findings
Feedback from participants after using the tool was very positive, with findings from a subsequent survey showing that some users reported an increase in their perceived data knowledge on climate change and tree stress, compared to the start of the study. Additionally, with participants reporting preferences for different or personalised audio-visual presentations, the benefits and need for multiple, or customisable data presentation approaches to facilitate data interpretation, was identified.

Conclusion
The Dendrostream project highlights a necessity to ensure data, particularly with respect to trees and the climate, is presented in accessible ways, to aid understanding. This work presents an initial exploration into the field, with future work, namely involving a more comprehensive evaluation user study, needed, to fully validate the findings.
On a personal level, this project was thoroughly enjoyable, particularly due to the importance of the research areas, and offered significant insights into climate change, tree data, and the challenges of successful data presentation.
Further Resources
🌐 Explore the Dendrostream web-based tool: https://stf-sv-tool.pages.dev
🎓 Read the accompanying dissertation: https://doi.org/10.5281/zenodo.17924731
📄 Read the 2025 Web Audio Conference initial exploration paper: https://doi.org/10.5281/zenodo.17642480
💻 View the frontend source code: https://github.com/sensingtheforest/dendrostream
⚙️ View the backend source code: https://github.com/sensingtheforest/dendrostream-api
Note: to comply with Queen Mary University of London (QMUL) School of Electronic Engineering and Computer Science (EECS) Devolved School Research Ethics Committee (DSREC) (reference: QMERC20.565.DSEECS25.032) ethical approval, individual participant responses are unavailable to third-parties. All responses reported in the thesis are aggregated. Please contact the paper’s authors for any enquiries.